


HTML
-
Dengue is the most important mosquito-borne febrile illness caused by any one of four distinctive antigenically related dengue virus serotypes (DENV-1–4), which are single positive-strand RNA viruses belonging to the family Flaviviridae, genus Flavivirus (Simmonset al. 2012). DENV is mainly transmitted by Aedes aegypti and Aedes albopictus. It is widely prevalent in more than 100 countries in tropical and subtropical areas (Tan et al. 2019). The clinical classification of DENV-infected disease includes two categories: dengue fever (DF), and dengue hemorrhagic fever/dengue shock syndrome (DHF/DSS) that is defined as severe dengue (Lin et al. 2017). The majority of DF cases are self-limited febrile illness, which is characterized by high fever, headache, rash, myalgia, and arthralgia (Screaton et al. 2015). However, severe dengue is more potentially fatal than DF, and usually leads to plasma leakage, severe bleeding or severe organ impairment (WHO 2009). As World Health Organization (WHO) reported, up to 400 million people get infected with dengue annually. Approximately 22, 000 people die from severe dengue, placing a heavy burden on global public health. Today, severe dengue has become a leading cause of hospitalization and death among people in most Asian and Latin American countries.
In Asia, after the Second World War, the incidence of dengue has grown dramatically in South-East Asia, particularly in Vietnam and Thailand. And severe dengue was first recognized in the 1950s in the Philippines and Thailand (Pinheiro and Corber 1997; Tavano and Boasso 2014). After the 20th century, the geographical distribution of dengue transmission was spanning westward from Southeast Asian countries to Sri Lanka, India, Pakistan and other regions, and eastward to China. In 1978, dengue case was first reported in Guangdong Province of China following with an increasing trend of the annual number (Guo et al. 2015; Lin et al. 2020). In mainland, the prevalence of DF expanded from the southeastern coastal areas to the northern and western regions subsequently (Lin et al. 2020).
Yunnan Province is located in southwest China and geographically bordering Myanmar, Laos and Vietnam where dengue is endemic. Additionally, abundant rainfall, humid environment and the tropical and subtropical monsoon climate favour mosquito breeding which provides suitable conditions for dengue outbreaks in Yunnan. In Yunnan Province, the first outbreak of dengue occurred in 2008 and involved 56 reported cases (Wu et al. 2010). In recent years, the number of imported cases and indigenous cases were gradually increasing, and all of four DENV serotypes were already detected in Yunnan Province (Reese et al. 2007; Zhao et al. 2016; Sang et al. 2019). Jinghong City, located on the south border of Yunnan Province, belongs to Xishuangbanna Dai Autonomous Prefecture of Yunnan Province. The frequent commercial intercourse and population movement with Southeast Asian countries are responsible for DENV rapid circulation and genetic evolution for recent years. For example, the imported dengue cases from Myanmar have been reported in Ruili City of Yunnan Province in 2008 (Zhang et al. 2013). In 2013, the first autochthonous and unexpected large outbreak of dengue was reported in Xishuangbanna (Zhang et al. 2014). A total of 1245 cases were identified in Jinhong City, and two counties, while 19 of which were identified as imported cases returned from Myanmar, Laos, and Thailand. The DENV-3 was confirmed to be the pathogen (Wang et al. 2017). Among the 136 laboratory confirmed cases, 70 were diagnosed as severe dengue according to the 2009 WHO guideline (WHO 2009). This is the first large severe dengue outbreak in Yunnan Province during recent decades (Wu et al. 2010). Since 2013, Xishuangbanna experienced severe dengue epidemics annually and the disease was endemic. Numerous indigenous cases were identified in Jinghong City. Indigenous dengue fever emerged gradually from Yunnan Province to the southeastern coastal provinces, and then to the central and northern provinces every year (Li et al. 2021).
During this outbreak in 2013, Aedes aegypti was detected for the first time in Xishuangbanna. The coincidence of a novel DENV strain and a more effective vector carried a high risk for a severe epidemic and endemicity into Xishuangbanna, a dengue-free region (Zhang et al. 2014). This phenomenon was quite different from that in other dengue hyperendemic regions, where most of the severe dengue cases experienced a secondary infection with a serotype which was different from the primary infection. The latter was believed to be due to antibody-dependent enhancement (ADE), the leading theory proposed to explain the happen of severe dengue in secondary cases (Halstead 2007; Wahala and Silva 2011).
ADE theory is confirmed by epidemiological investigation (Guzman et al. 1990). Primary infections with one DENV serotype stimulate durable serotype-specific antibodies, implicated in long-term protection against reinfection by the homologous serotype, and produce short-term protective antibodies against heterologous serotypes that may last 3–6 months (Cedillo-Barron et al. 2014; Guy et al. 2016). When the body is secondarily infected with heterologous DENV, the severity of the disease depends on the age at the time of the infection and the interval between the two infections (Halstead 2019). As the infection time marches on, ADE is easy to occur when the concentration of neutralizing antibody (NAb) in vivo gradually decreases to a sub-neutralization concentration, and it is more likely to be caused by heterologous antibodies than homologous antibodies. Meanwhile, it has been proved that there is a degree of correlation between the decrease of the heterologous NAb over time and the severity of secondary infection (Guzman et al. 2007; Wahala and Silva 2011). Hence, dynamic investigation of the concentration of DENV-specific antibodies in high-risk regions is imperative. Thus, whether the concentration of antibody changes with time after infection and whether secondary infection is prone to cause DSS/DHF have aroused our special attention.
At present, it is still a lack of kinetic monitoring of the attenuation pattern of specific antibodies after DENV infection. In this seroepidemiologic study, we utilized sera samples collected in different convalescent phase from dengue fever patients in Jinghong City in 2013, to explore the dynamic change rule of DENV-specific antibodies. We hope that the follow-up serosurvey will provide experimental data for the risk prediction of severe dengue causes by secondary infection of DENV.
-
Jinghong City is located in the middle of Xishuangbanna Dai Autonomous Prefecture in Yunnan Province. It (21°27′–22°36′ N, 100°25′–101°31′ E) encompasses 6867 square kilometers. The resident population is 1.18 million. It borders Mengla County to the east, Pu'er City to the north, Burma to the south and is close to Laos and Thailand. The hot and humid environment contributed to a breeding ground for mosquitoes, which carried a variety of diseases including dengue.
-
The serum samples were collected from patients at different convalescence who were infected with DENV in Jinghong City, Yunnan Province in 2013. The pathogen of this outbreak was DENV-3 confirmed by nucleic acid detection and virus isolation (Zhang et al. 2014). The inclusion criteria were that: (1) laboratory-confirmed cases with positive DENV-specific non-structural antigen-1 and diagnosis as DF according to the criteria (National Health Commission of the People's Republic of China, WS 216-2008)) (National Health Commission 2008); (2) patients hospitalized in Jinghong Infectious Diseases Hospital and Xishuangbanna Dai Autonomous Prefecture People's Hospital from April to December, 2013; (3) long-term resident in Jinghong City. The exclusion criteria included patients whose personal data were uncomplete or who were transferred to other hospitals.
A total of 290 serum samples from participants were collected in Jinghong City, respectively. First of all, for baseline serosurvey, 191 serum samples were collected at April 2017 and were defined as the four-year convalescent serum samples and 99 serum samples were collected in 2019 and were defined as the six-year convalescent samples. A total of 73 of the 191 (38.2%) people still living in the previously recorded locations were revisited and provided another serum sample in 2019. These 73 paired consecutive samples were used for follow-up serosurvey.
-
Vero cells (African green monkey kidney cells, ATCC CRL-1586) were cultivated in minimum essential medium supplemented with 5% fetal bovine serum (FBS, ST30-3302, PAN, Germany) and 1% penicillin. C6/36 cells (Aedes albopictus cells, ATCC CRL- 1660) and K562 cells (ATCC CCL-243) were cultured in RPMI 1640 (11835030, Gibco, USA) containing 10% FBS and 1% penicillin. DENV-1 strain Hawaii, DENV-2 strain New Guinea, DENV-3 strain H87 and DENV-4 strain H241 were provided by the Guangdong Provincial Center for Disease Control and were propagated in C6/36 cell cultures. All viruses were frozen in −80 ℃ until use and the titer was tested by plaque assay on Vero cells.
-
Immunoglobulin G (IgG) detection was performed with a mixed anti-DENV IgG capture ELISA kit (Beijing BGI-GBI Biotech Co., Ltd., China, 20173403323). The antigen coated on the commercialized plate was the recombinant DENV fusion proteins expressed in E.coli. According to the manufacturer's instructions, for the specific detection, the ELISA kit could detect all of four DENV serotypes as a qualitative test of broad spectrum dengue antibody, but the cross-reactivity of Japanese encephalitis virus and yellow fever virus antibodies couldn't be ruled out.
In a brief, the serum was diluted in 1:10 and added to the test plate, which was pre-coated with mixed DENV nonstructural proteins. Then, the plate was incubated at 37 ℃ for 30 min and horseradish peroxidase-conjugated mouse anti-human IgG (3D3) monoclonal antibody was added for another 30 min. Finally, the carbamide peroxide and 3, 3, 5, 5-tetramethylbenzidine were added and incubated at 37 ℃ for 10 min. Then, 2 mol/L H2SO4 was used to end the reaction. The optical density (OD) was measured at 450 nm using the ELISA scanner (2805880, Thermo, USA). For negative control, the commercial serum without DENV-specific IgG was used to delimit the cut-off value. The serum containing DENV-specific IgG with OD value ≥ 0.5 served as positive control.
-
PRNT was used to determine the level of NAb in serum samples. Briefly, serum samples were inactivated for 30 min at 56 ℃, and were then serially diluted two-fold (1:10 to 1:1280) with MEM (10370021, Gibco) supplemented with 2% FBS. Then, 100 μL of the serum was mixed with an equal volume of viruses, and was incubated for 60 min to ensure adequate neutralization at 37 ℃ with 5% CO2. After incubation, the virus-serum mixture was added to 24-well plates containing confluent Vero cells and was incubated for 1 h at 37℃ with 5% CO2. The overlay medium (made up in 5% FBS, 1% penicillin and glutamine mixture) was added to the plates and cultured for 5–9 days at 37 ℃ with 5% CO2. Finally, the plates were stained with crystal violet for 1 h for counting the plaques. The reciprocal highest serum dilution that corresponded to a 50% reduction of the average number of plaques on the virus infection wells was determined as the neutralizing titer PRNT50.
Site and Populations
Specimen Collection
Virus and Cell
Enzyme-Linked Immunosorbent Assay (ELISA)
Plaque Reduction Neutralization Test (PRNT)
-
The ADE assay was performed and followed with the description by Guyet al. (Guy et al. 2004). Serial 10-fold dilutions of heat-inactivated sera were incubated with DENV at different multiplicity of infection (0.25 for DENV1, 0.10 for DENV-2, and 0.05 for DENV-4) for 30 min at 37 ℃. K562 cells were added to 24-well plates with density of 5 × 10⁵ cells per well containing RPMI 1640 supplemented with 10% FBS and 1% penicillin. Then, the virus-serum mixture was transferred into K562 cells for 1 h at 37 ℃ and 5% CO2. Next, K562 cells were washed and resuspended with RPMI 1640. After cultured for 48 h, K562 cells were fixed with 4% paraformaldehyde for 10 min and were permeabilized with saponin (P0095, Beyotime, China) at room temperature. Monoclonal antibody 4G2 (D1-4G2-4-15 cell line, ATCC HB-112) from cell supernatant was diluted at 1:3 and was used to stain the K562 cells for 1 h. Goat anti-mouse IgG (Alexa Fluor 488-conjugated, AS001, ABclonal, China, 1:1000) was staining as secondary antibody for 1 h at 4℃. The K562 cells incubated with the 4G2-DENV complexes were defined as positive control. The quantity of infected K562 cells was detected by DxFLEX flow cytometer (Beckman Coulter, USA), and analysis was conducted by CytExpert software (version 2.0, Beckman Coulter, USA). The fold enhancement was calculated as percent of infected cells in the presence of antibody to percent of infected cells without antibody. For the ADE analysis, the constant reciprocal dilution of sera (X-axis) and fold enhancement (Y-axis) formed the curves. The area under curve (AUC) was calculated by an area which enclosed with coordinate axis under receiver operating characteristic curve with serum dilutions, and the ADE enhancement was recorded as AUC. Dengue-negative serum samples from healthy subjects served as negative controls.
-
All data were analyzed by the SPSS20.0 and GraphPad Prism software (Version 8.0). Data were tested whether accorded with normal distribution and variance homogeneity. For the positive rate of DENV-specific IgG, the Chi-square test was used to identify differences between four-year and six-year sera. For the level of NAb, recorded as the geometric mean titers (GMT), the differences were analyzed by the Wilcoxon rank sum test. For the risk analysis, the odds ratio (OR) was calculated by logistic regression. The 95% confidence interval (C.I.) was calculated with the upper and lower bounds of the statistics in the results of NAb titer and the OR. The P < 0.05 was considered statistically significant.
Statistical Analysis
-
The demographic characteristics of all participants were summarized in Table 1. In 2017, 191 convalescent sera were collected, 63 (33.0%) of which were males, the other 128 (67.0%) were females, with the male-female ratio of 0.49. The mean age of participants was 45 ± 14.8 which ranged from 8 to 76 years. We grouped them in decade increments. The highest proportion of participants was in the 41–50 years group (27.7%) and the lowest was in 0–10 years group (1.6%). Of the 99 participants enrolled in 2019, 32 (32.3%) were males, 67 (67.7%) were females, and the male-female ratio was 0.48. The mean age of participants was 45.7 ± 12.1 which ranged from 6 to 83 years. The 41–50 years group had the highest proportion (34.5%), while the 0–10 years group had the lowest (1.0%).
Variables Seropositive, n (%) P-valuec 2017a 2019b Gender Male 63/63 (100) 28/32 (87.5) ns Female 125/128 (97.7) 54/67 (80.6) < 0.0001 Age (y) 0–10 3/3 (100) 1/1 (100) ns 11–20 9/9 (100) 4/4 (100) ns 21–30 16/16 (100) 3/4 (75.0) ns 31–40 37/37 (100) 23/24 (95.8) ns 41–50 52/53 (98.1) 24/35 (68.6) 0.0001 51–60 40/42 (95.2) 21/24 (87.5) ns > 60 31/31 (100) 6/7 (85.7) ns Total 188/191 (98.4) 82/99 (82.8) 0.0004 a Four-year serum samples collected in 2017.
b Six-year serum samples collected in 2019.
c The statistical analysis was performed by Chi-square test.
IgG, immunoglobulin G; DENV, dengue virus; ns, no significance.Table 1. Demographic characteristics of participants and positive rates of DENV-specific IgG antibodies in patients at four-year and six-year convalescent phases for baseline serosurvey.
Demographic Characteristics of Participants
-
The seropositive rates of serum IgG against DENV were detected by ELISA and were shown in Table 1. Firstly, of 191 serum samples collected in 2017, the overall dengue IgG-positive rate was still as high as 98.4% (188/191) four years after DENV infection. In 2019, the positive rate of serum IgG was 82.8% (82/99) in those with a prognosis of six years. It meant that the DENV-specific IgG seroconversion rate decreased with the time elapsed post-infection (P = 0.0004). Moreover, the waning trend of IgG-positive rate was more pronounced in female (from 97.7% to 80.6%, P < 0.0001) than in male (from 100% to 87.5%). Meanwhile, in different age groups, significant decreasing of seropositivity was only observed in 41–50 age groups after two years (98.1% vs. 68.6%, P = 0.0001).
-
To investigate the change of DENV-3 specific NAb in convalescent sera, overall samples collected at four- or six-years post-infection were assayed by PRNT50. The distribution of NAb titers in overall sample population was shown in Fig. 1. At the fourth year of prognosis, NAb against DENV-3 could still be detected in 98.4% (188/191) participants. Among them, the highest percentage of 27.2% was found at the NAb titer of 1:320. The NAb titer of 1:1280 owned the lowest percentage of 0.5% (Fig. 1A). In three patients' sera, the PRNT50 titers were less than 1:10, indicating that 1.6% of four-year serum specimens had completely lost their neutralizing activity.
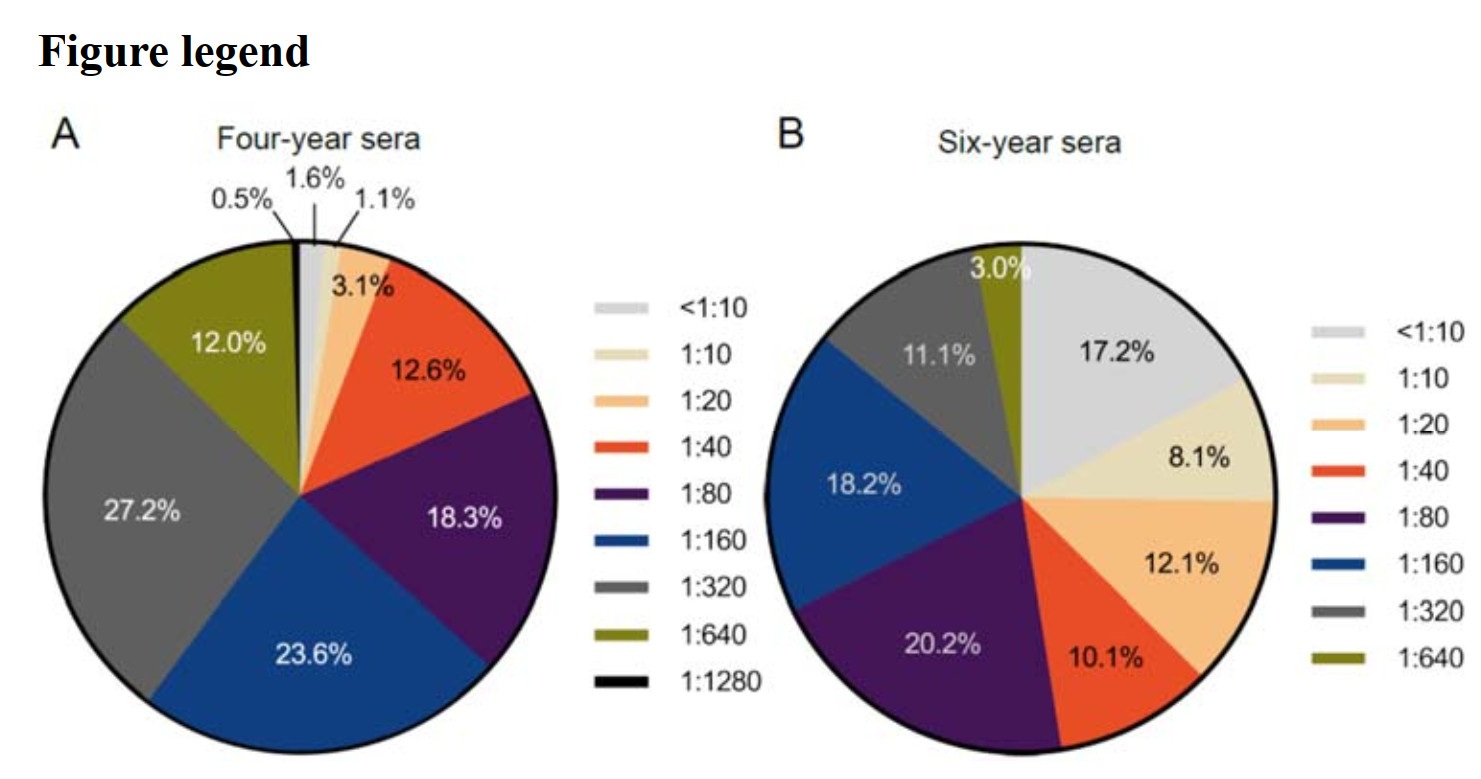
Figure 1. The titer distribution of NAb against DENV-3 in overall serum samples for baseline serosurvey. A NAb titers in four-year sera collected in 2017 (n = 191). B NAb titers in six-year sera collected in 2019 (n = 99). NAb, neutralizing antibody; DENV, dengue virus.
In six-year serum samples, the peak percentage of PRNT50 titer achieved 20.2% which occurred at the NAb titer of 1:80 (Fig. 1B), and the lowest percentage was 3.0% which was observed at the titer of 1:640. NAb against DENV-3 was detected in 82.8% (82/99) of samples, which was less than that in four-year sera (P < 0.0001). NAb against DENV-3 was undetectable (titer < 1:10) in 17.2% of the patients. In addition, as compared with the highest titer in four-year sera, the titer of 1:1280 was not observed in six-year sera. These results demonstrated that the neutralizing activity decreased significantly in two-year interval.
-
The GMT of NAb against DENV-3 in overall samples was presented with subset variables of gender and age (Table 2). In six-year serum samples, the GMT decreased to 1:46.66 (95% C.I. 35.09–62.04) as two years passed, which was dramatically lower than that of the four-year sera (P < 0.0001). In the male group, the GMT in six-year sera was significantly lower than that in four-year sera [1:59.07 (95% C.I. 36.13-96.58) vs. 1:160 (95% C.I. 125.12-204.61), P = 0.0001]. Similarly, there was a sharp decline in the GMT of the female population [1:153.06 (95% C.I. 129.18-181.34) vs. 1:41.69 (95% C.I. 29.33-59.24), P < 0.0001]. In age groups, the highest GMT of the specimens collected in two different convalescent phases was both observed in 11–20 years group. Meanwhile, statistically significant decrease of the GMT was found in age groups of 31–40, 41–50 and 51–60 years (P = 0.0074, P < 0.0001, P = 0.0472, respectively).
Variables NAb against DENV-3a P-valued 2017b (95% C.I.) 2019c (95% C.I.) Gender Male 160.00 (125.12–204.61) 59.07 (36.13–96.58) 0.0001 Female 153.06 (129.18–181.34) 41.69 (29.33–59.24) < 0.0001 Age (y) 0–10 126.99 (47.74–337.79) 80.00 (80.00–80.00) ns 11–20 201.59 (125.07–324.92) 134.54 (100.25–180.55) ns 21–30 146.72 (107.09–201.02) 40.00 (13.49–118.59) ns 31–40 157.03 (110.21–223.74) 62.33 (38.13–101.88) 0.0074 41–50 164.32 (122.00–221.32) 24.16 (14.77–39.50) < 0.0001 51–60 134.54 (102.64–176.36) 63.50 (35.22–114.14) 0.0472 > 60 163.62 (119.66–223.72) 72.46 (24.65–212.96) ns Total 155.35 (135.20–178.51) 46.66 (35.09–62.04) < 0.0001 a NAb titers were quantified by PRNT50 and the data were shown as GMT (95% C.I.).
b Four-year serum samples collected in 2017.
c Six-year serum samples collected in 2019.
d The statistical analysis was performed by Wilcoxon rank-sum test.
PRNT50, the reciprocal highest serum dilution that corresponded to a 50% reduction of the average number of plaques on the virus infection wells; GMT, geometric mean titer; NAb, neutralizing antibody; DENV, dengue virus; C.I., confidence interval; ns, no significance.Table 2. The GMT of NAb against DENV-3 in different gender and age populations at two convalescent phases for baseline serosurvey.
-
To estimate the general change of NAb in overall samples who infected with DENV-3, PRNT50 titers were categorized as high (1:321–1:1280), medium (1:81–1:320), low-medium (1:21–1:80) and low (< 1:20) titer groups (Fig. 2). Firstly, in four-year sera, the majority (81.7%) of the samples exerted NAb titers of 1:21–1:80 (30.9%) and 1:81–1:320 (50.8%), respectively. Moreover, 12.6% of samples kept the high neutralizing activity with the titers of 1:321–1:1280 four years after the DENV infection. Only 10 (5.7%) of 191 specimens had low NAb titers less than 1:20. Secondly, in six-year sera, the proportion of the population with high, low-medium, medium and low titers were 3%, 30.3%, 29.3% and 37.4%, respectively. Obviously, the high level of NAb was transformed to medium and low levels with the convalescence prolonged.
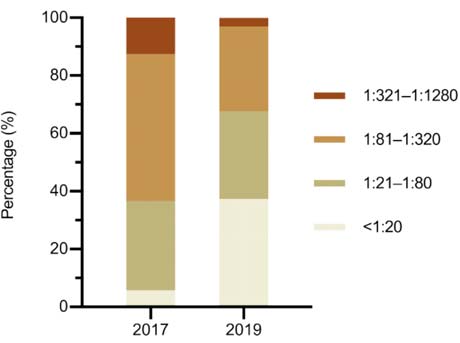
Figure 2. Titer classification of DENV-3 specific NAb in overall serum samples for baseline serosurvey (n = 191 in 2017 group, n = 99 in 2019 group). NAb, neutralizing antibody; DENV, dengue virus.
Dynamic Seroprevalence of IgG in Overall Samples
The Titer Distribution of NAb Against DENV-3 in Overall Samples
The GMT of NAb Against DENV-3 in Different Gender and Age Populations at Two Convalescent Phases for Baseline Serosurvey
Classification of DENV-3 Specific NAb Titers in Overall Samples
-
Of all participants, 73 people were sampled both in 2017 and 2019. Their paired serum samples in different convalescent phases of dengue were analyzed as consecutive samples in this study. The demographic data were shown in Table 3. Totally, 22 (30.1%) participants were males, and 51 (69.9%) were females, with the male-female ratio as 0.43. The age distribution of consecutive participants ranged from 9 to 65 years, with a mean age of 44.2 ± 10.9 years. Of these 73 participants, 28 participants (38.4%) were 41–50 years old, accounted for the highest number of all age groups.
Variables Seropositive, n (%) P-valuec 2017a 2019b Gender Male 22/22 (100) 19/22 (86.4) ns Female 51/51 (100) 37/51 (72.5) < 0.0001 Age (y) 0–10 1/1 (100) 1/1 (100) ns 11–20 1/1 (100) 1/1 (100) ns 21–30 3/3 (100) 2/3 (66.7) ns 31–40 18/18 (100) 17/18 (94.4) ns 41–50 28/28 (100) 17/28 (60.7) 0.0002 51–60 18/18 (100) 15/18 (83.3) ns > 60 4/4 (100) 3/4 (75.0) ns Total 73/73 (100) 56/73 (76.7) < 0.0001 a Four-year serum samples collected in 2017.
b Six-year serum samples collected in 2019.
c The statistical analysis was performed by Chi-square test.
IgG, immunoglobulin G; DENV, dengue virus; ns, no significance.Table 3. Demographic characteristics of participants and positive rates of DENV-specific IgG antibodies in patients at four-year and six-year convalescent phases for follow-up serosurvey.
To further investigate the change of DENV-specific IgG antibody, the IgG positive rate of 73 pairs of consecutive sera was analyzed for follow-up serosurvey. The seroprevalence in four-year sera exerted a significant difference with that in six-year sera (100% vs. 76.7%, P < 0.0001) (Table 3). Meanwhile, in the female group, the positive rate of DENV-specific IgG in six-year sera decreased by 27.5% when compared with four-year sera (100% vs. 72.5%, P < 0.0001). In age group of 41–50 years old, after two years, the positive rate of DENV-specific IgG decreased from 100% to 60.7%. The dengue-specific IgG of 11 specimens converted to negative after two years of convalescence.
-
As shown in Table 4, in consecutive samples, the GMT of NAb in four-year sera was 1:167.70 (95% C.I. 134.55–209.22) which presented a nearly 3-fold potency than that in six-year sera with the GMT titer of 1:53.18 (95% C.I. 37.11–76.20). The greatest decrease was observed in the female group [1:183.29 (95% C.I. 140.80-238.61) vs. 1:46.45 (95% C.I. 30.42-70.94), P < 0.0001]. In six-year sera, GMTs decreased in all age groups, but only the decline of GMT in the age groups of 41–50 and 51–60 years old had statistical significance (P < 0.0001, P = 0.0443).
Variables DENV-1 P-valuec DENV-2 P-valuec DENV-3 P-valuec DENV-4 P-valuec 2017a
(95% C.I.)2019b
(95% C.I.)2017a
(95% C.I.)2019b
(95% C.I.)2017a
(95% C.I.)2019b
(95% C.I.)2017a
(95% C.I.)2019b
(95% C.I.)Gender Male 15.06
((10.40–20.70)11.71
(9.29–16.14)ns 22.69
(13.61–37.80)20.64
(12.40–34.35)ns 136.68
(92.55–201.85)82.56
(44.67–152.60)ns 56.57
(40.00–80.00)10.99
(7.81–15.47)< 0.0001 Female 13.12
(10.25–16.22)9.87
(9.29–16.14)0.0489 16.99
(13.63–21.18)12.60
(9.35–16.99)ns 183.29
(140.80–238.61)46.45
(30.42–70.94)< 0.0001 41.10
(32.30–52.31)7.22
(6.20–8.40)< 0.0001 Age (y) 0–10 10.00
(10.00–10.00)5.00
(5.00–5.00)ns 10.00
(10.00–10.00)5.00
(5.00–5.00)ns 160.00
(160.00–160.00)80.00
(80.00–80.00)ns 160.00
(160.00–160.0)10.00
(10.00–10.00)ns 11–20 40.00
(40.00–40.00)40.00
(40.00–40.00)ns 20.00
(20.00–20.00)80.00
(80.00–80.00)ns 640.00
(640.00–640.00)160.00
(160.00–160.00)ns 40.00
(40.00–40.00)20.00
(20.00–20.00)ns 21–30 25.20
(9.47–67.02)10.00
(5.27–18.97)ns 20.00
(10.54–37.95)6.30
(4.35–9.12)ns 126.99
(87.74–183.81)80.00
(22.22–287.98)ns 25.20
(12.03–52.79)10.00
(5.27–18.97)ns 31–40 12.60
(9.32–17.03)9.62
(7.05–13.13)ns 17.14
(11.75–25.03)17.14
(10.83–27.15)ns 148.14
(98.13–223.64)96.99
(57.61–163.26)ns 52.40
(34.30–74.05)8.57
(6.16–11.92)0.0002 41–50 11.90
(9.84–14.37)8.41
(6.80–10.40)0.0311 16.82
(12.05–23.48)9.28
(6.81–12.65)0.0013 172.33
(112.68–263.57)27.59
(15.70–48.48)< 0.0001 42.03
(29.44–60.00)7.07
(5.72–8.74)< 0.0001 51–60 15.27
(9.35–24.95)13.61
(8.52–21.73)ns 20.79
(12.82–33.69)31.75
(13.75–58.07)ns 186.64
(129.85–268.29)80.00
(38.48–166.30)0.0443 46.66
(32.46–67.07)8.57
(5.96–12.32)< 0.0001 > 60 16.81
(9.57–29.53)16.82
(6.96–40.64)ns 33.64
(9.13–123.97)8.41
(4.79–14.77)ns 134.54
(64.18–282.06)56.57
(9.08–352.30)ns 47.57
(22.69–99.72)10.00
(6.19–16.17)ns Total 13.80
(11.60–16.41)10.30
(8.66–12.46)0.0136 18.54
(14.93–23.01)14.60
(11.27–18.97)ns 167.70
(134.55–209.22)53.18
(37.11–76.20)< 0.0001 45.26
(37.01–55.33)8.17
(7.00–9.53)< 0.0001 NAb titers were quantified by PRNT50 and the data were shown as GMT (95% C.I.).
a Four-year serum samples collected in 2017.
b Six-year serum samples collected in 2019.
c The statistical analysis was performed by Wilcoxon rank sum test.
GMT, geometric mean titer; NAb, neutralizing antibody; DENV, dengue virus; C.I., confidence interval; ns, no significance; PRNT50, the reciprocal highest serum dilution that corresponded to a 50% reduction of the average number of plaques on the virus infection wells.Table 4. The GMT distribution of NAb against DENV-3 and cross-reactive antibody against DENV-1, DENV-2 and DENV-4 in different populations in consecutive samples for follow-up serosurvey (n = 73).
The change of NAb titers against DENV-3 in consecutive sera was similar with that in overall samples. Six years after infection, the GMT of NAb against DENV-3 in 69.9% (51/73) of the specimens displayed a decline from 1:204.35 (95% C.I. 155.81–268.01) to 1:31.32 (95% C.I. 20.99–46.73) (Fig. 3A-a). Meanwhile, the titer of NAb in 12.3% (9/73) of the samples remained unaltered (Fig. 3A-b). However, we found that the NAb titer of 17.8% (13/73) of the samples rose from 1:89.00 (95% C.I. 58.83–134.65) to 1:272.70 (95% C.I.189.00–393.47) (Fig. 3A-c). Among them, the maximum increase of NAb titer (No.71) changed from 1:40 to 1:640. We speculated that the most common reason was subsequent infection during the convalescent phase.

Figure 3. The titer distribution of neutralizing and cross-reactive antibodies in consecutive serum samples for follow-up serosurvey (n = 73). A The titer of NAb against DENV-3. B–D Cross-reactive antibodies against DENV-1 (B) DENV-2 (C) and DENV-4 (D). The first row was ordered by the titers of NAb against DENV-3 and grouped into NAb-decreased samples (a), NAb-unaltered samples (b) and NAb-increased samples (c). Every longitudinal column including eight bars (DENV-1–4 of 2017 and 2019) represented the paired samples from the same participant. NAb, neutralizing antibody; DENV, dengue virus.
-
When infected with DENV, recovered patients would generate specific NAb as well as cross-reactive antibodies simultaneously (St John and Rathore 2019). We paired consecutive serum samples at two follow-up visits to investigate the variation of cross-reactive antibodies against DENV serotype 1, 2 and 4 (Table 4).
The total GMT of the cross-reactive antibody against DENV-1 decreased from 1:13.80 (95% C.I. 11.60–16.41) to 1:10.30 (95% C.I. 8.66–12.46). In 52.1% (38/73) samples, after two years, the titer of the antibody displayed a decline. Meanwhile, the titer of cross-reactive antibody remained unaltered in 30.1% (22/73) of the samples, and rose in 17.8% (13/73) of the samples (Fig. 3B).
The total GMT of the cross-reactive antibody against DENV-2 decreased from 1:18.54 (95% C.I. 14.93–23.01) to 1:14.60 (95% C.I. 11.27–18.97). In 53.4% (39/73) specimens, the titers declined, and the proportions of titer-unaltered and titer-increased samples were 23.3% (17/73) and 23.3% (17/73), respectively (Fig. 3C).
In six-year sera, the GMT of cross-reactive antibodies against DENV-4 was dramatically lower than four-year sera [1:8.17 (95% C.I. 7.00-9.53) vs. 1:45.26 (95% C.I. 37.01-55.33), P < 0.0001] (Table 4). In gender groups, the significant decrease was observed both in the male and female groups (P < 0.0001, P < 0.0001, respectively). Statistical significance was only observed in the age group of 31–40, 41–50 and 51–60 years old when comparing the four-year and six-year sera (P = 0.0002, P < 0.0001, P < 0.0001, respectively). As shown in Fig. 3D, in 93.2% (68/73) of the samples, the level of cross-reactive antibodies against DENV-4 decreased after two years. Among them, the antibody was undetectable in 40 samples. Simultaneously, the level of the antibody remained unchanged in 4.1% (3/73) of the samples and increased in 2.7% (2/73) of the samples.
The results suggested that in patients infected with DENV-3, cross-reactive antibodies against DENV-1, DENV-2 and DENV-4 were detected in four-year sera. However, the decreasing trends of the cross-reactive antibodies were different with the convalescence being prolonged. The GMT of the cross-reactive antibody against DENV-4 declined the most.
-
ADE hypothesis was associated with the concentration of sub-neutralizing antibody and the interval between primary and secondary infection (Cedillo-Barron et al. 2014; Screaton et al. 2015). To investigate the risk of secondary heterologous DENV infection in consecutive samples from different convalescent phases, we evaluated the in vitro enhancement of DENV-1, DENV-2, and DENV-4 for follow-up serosurvey using K562 cells bearing Fc-γ receptor (Supplementary Fig. S1). The ADE enhancement was calculated as AUC based on serially-diluted sera and was showed in Fig. 4.
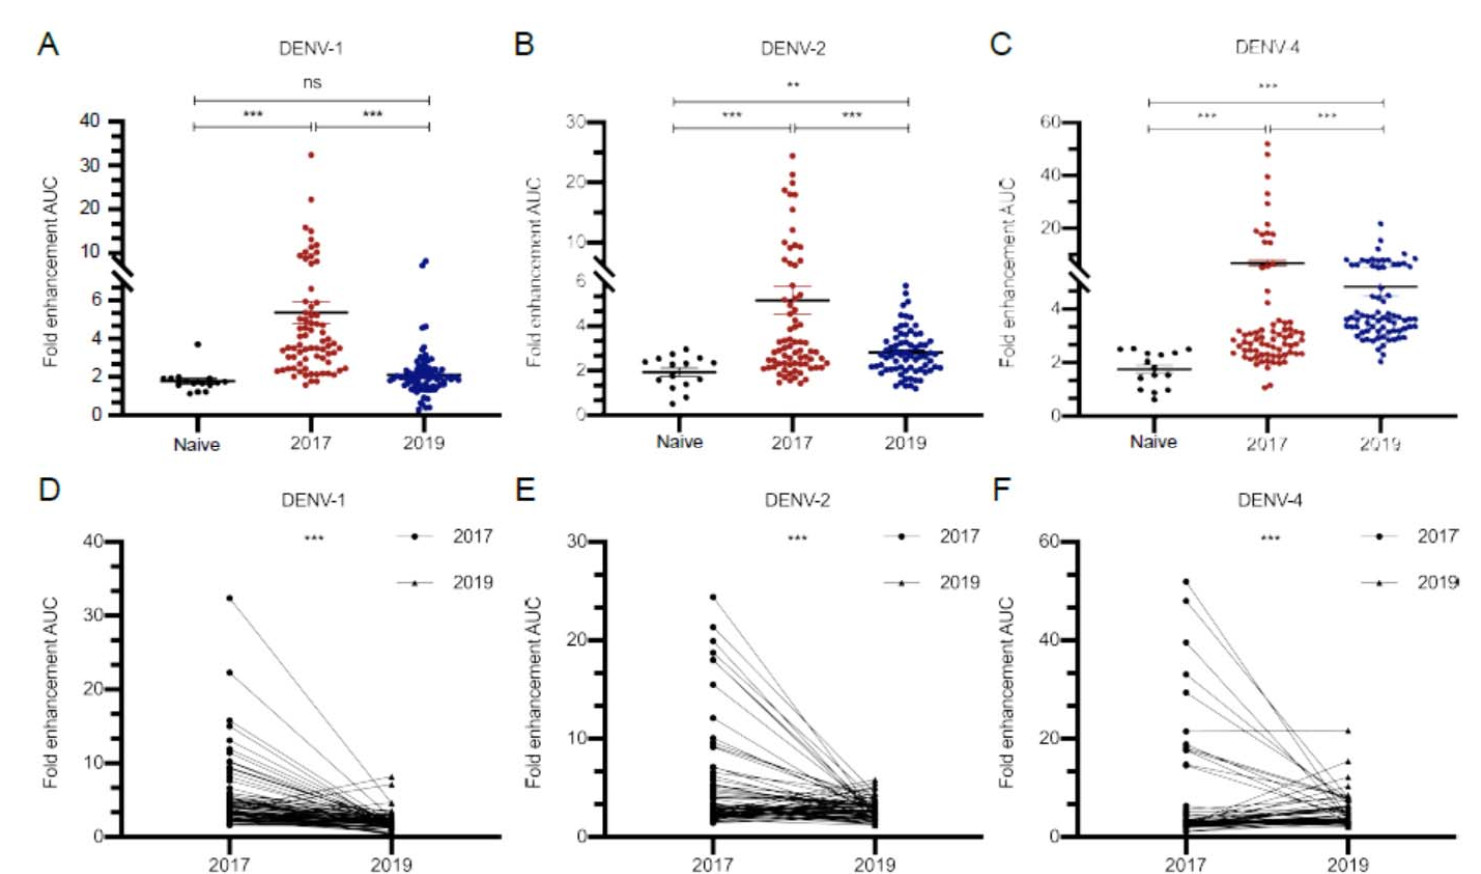
Figure 4. Enhancement (calculated as AUC) of DENV-1, DENV-2 and DENV-4 infections in K562 cells triggered by consecutive serum samples (n = 73 in 2017 and 2019 groups, n = 15 in naive group). A–C Scatterplots showing the enhancement in each sample. Data are shown as mean with SD. D–F Line plots (connecting means) showing the enhancement relationship and change between each paired consecutive serum sample. (**P < 0.01, ***P < 0.001). Dengue-negative serum samples from healthy subjects served as naive group. Data were non normal distribution and were analyzed by Wilcoxon rank sum test. AUC, area under curve; DENV, dengue virus; ns, no significance.
After infection of DENV-1, an obvious enhancement was exhibited in four-year sera, while the mean level of which was 3-fold greater than naïve sera, and then, the effect almost disappeared after two years (P < 0.001, Fig. 4A). We paired the 73 consecutive sera, and found that enhancement in 91.8% (67/73) samples decreased after two years (Fig. 4D).
Fig. 4B showed that, an 1.8-fold decline of the mean level of ADE, caused by DENV-2 infection, was observed in six-year sera as compared with four-year sera (P < 0.001). Among them, 67.1% (49/73) samples showed the attenuated enhancement, while 32.9% (24/73) of the samples appeared a slight increase two years later (Fig. 4E).
After infection of DENV-4, a high level of ADE was observed in both of four-year and six-year sera when compared with naïve sera (P < 0.001, Fig. 4C). Interestingly, as shown in Fig. 4F, although the mean level of ADE effect decreased in six-year sera as compared with four-year sera (Fig. 4C), 52 (71.2%) samples exerted the increasing enhancement effect with the extension of convalescent phase (Fig. 4F).
-
To quantify the risk of ADE after infection with heterotypes of DENV, we classified the values of enhancement AUC to assess the proportion of ADE in consecutive serum samples. The AUC ≤ 5, between 6 to 15, and ≥ 16 were categorized as low, medium and high levels of ADE effect, respectively. Then we used four-year samples as a reference to estimate the risk in six-year samples (Table 5). The OR value was used to evaluate the strength of the association between the occurrence of ADE effect and the time-varying risk factor.
Variables DENV-1 OR (95% C.I.) P-valuec DENV-2 OR (95% C.I.) P-valuec DENV-4 OR (95% C.I.) P-valuec 2017a 2019b 2017a 2019b 2017a 2019b Gender Male 4 1 4.67 (0.48–45.62) ns 10 4 0.27 (0.07–1.05) ns 10 19 7.60 (1.73–33.35) 0.007 Female 26 5 0.11 (0.04–0.31) < 0.001 29 18 0.41 (0.19–0.92) 0.030 14 29 3.48 (1.52–7.97) 0.003 Age (y) 0–10 0 1 9.00 (0.10–831.78) ns 1 1 1.00 (0.01–92.42) ns 0 1 9.00 (0.10–831.78) ns 11–20 0 0 1.00 (0.01–92.42) ns 1 0 0.11 (0.00–10.27) ns 1 1 1.00 (0.01–92.42) ns 21–30 1 1 1.00 (0.03–29.81) ns 1 2 4.00 (0.13–119.23) ns 1 3 11.67 (0.32–422.14) ns 31–40 9 1 0.06 (0.01–0.54) 0.012 7 2 0.20 (0.03–1.13) ns 3 13 13.00 (2.59–65.20) 0.002 41–50 12 2 0.10 (0.02–0.52) 0.006 18 10 0.31 (0.10–0.92) 0.035 11 16 2.06 (0.71–5.98) ns 51–60 5 1 0.15 (0.02–1.47) ns 11 5 0.25 (0.06–0.99) 0.049 7 13 4.09 (1.01–16.58) 0.049 > 60 2 0 0.10 (0.00–3.35) ns 0 2 9.00 (0.30–271.70) ns 1 2 3.00 (0.15–59.89) ns AUC ≤ 5 25 4 0.07 (0.02–0.22) < 0.001 21 19 0.62 (0.29–1.31) ns 10 29 5.68 (2.39–13.50) < 0.001 6–15 15 2 0.16 (0.00–10.14) ns 12 3 0.09 (0.00–2.83) ns 4 18 4.11 (0.07–236.69) ns ≥ 16 3 0 0.14 (0.00–19.45) ns 6 0 0.08 (0.00–9.95) ns 10 1 0.14 (0.00–10.29) ns a The number of ADE-positive sera in four-year samples collected in 2017.
b The number of ADE-positive sera in six-year samples collected in 2019.
c The statistical analysis was performed by logistic regression.
DENV, dengue virus; AUC, area under curve; OR, odd ratio; C.I., confidence interval; ns: no significance.Table 5. Risk factor analysis of enhancement of DENV-1, DENV-2 and DENV-4 infections triggered by consecutive sera in different populations and AUC groups (n = 73).
In gender-associated analysis, the valid data shown in Table 5 suggested that, the OR of female group in DENV-1 and DENV-2 infection was 0.11 (95% C.I. 0.04–0.31) and 0.41 (95% C.I. 0.19–0.92) in six-year sera when compared with four-year sera (P < 0.001, P = 0.030, respectively). The risk of ADE was negative correlated with the extension of convalescent phase in DENV-1 and DENV-2 infection. However, in DENV-4 infection, the ADE risk both in female and male groups showed 3.48-fold and 7.60-fold rise (OR = 3.48, 95% C.I. 1.52–7.97, P = 0.003; OR = 7.60, 95% C.I. 1.73–33.35, P = 0.007, respectively).
In age-stratified analysis, the risk of ADE after infection of DENV-4 was positively associated with the extension of convalescent phase only in age groups of 31–40 and 51–60 years old (OR = 13, 95% C.I. 2.59–65.20, P = 0.002; OR = 4.09, 95% C.I. 1.01–16.58, P = 0.049, respectively).
The AUC ≤ 5 group conducted a significantly decreasing risk in enhancement of DENV-1 infection (OR = 0.07, 95% C.I. 0.02–0.22, P < 0.001). However, on the contrary, in secondary DENV-4 infection, the high OR implied an obviously elevated risk of ADE (OR = 5.68, 95% C.I. 2.39–13.50, P < 0.001).
Dynamic Seroprevalence of IgG in Consecutive Samples for Follow-up Serosurvey
The GMT of NAb Against DENV-3 in Different Gender and Age Populations at Two Convalescent Phases for Follow-up Serosurvey
Dynamic Changes of Cross-Reactive Antibodies Against DENV-1, DENV-2 and DENV-4 in Consecutive Samples for Follow-up Serosurvey
The Change of ADE Effect in Consecutive Serum Samples for Follow-up Serosurvey
Risk Factor Analysis of Enhancement of DENV Infection Triggered by Consecutive Sera in Different Populations and AUC Groups
-
Yunnan Province especially Xishuangbanna had become a natural repository for DENV and other highly pathogenic emerging arboviruses due to the unique location. Since DENV-3 was introduced in 2013 and led to a large-scale epidemic in this area, the intensity of dengue activity varied from year to year, and patient's seroconversion remained relatively unknown. In present study, taking advantage of our baseline serosurvey and follow-up serosurvey over four and six years in Jinghong City, we estimated the kinetic monitoring of the attenuated pattern of DENV-specific antibodies.
In this study, whatever in four-year or six-year sera, the positive rates of DENV-specific IgG kept more than 82.8%, consistent with some epidemiological data, which suggested that IgG antibody could last for even decades after infection. For instance, in a serological survey in Zhejiang Province, China (Luo et al. 2018), the positive rate of serum IgG in dengue symptomatic individuals was still as high as 96.61% three years after infection. Moreover, longitudinal epidemiological researches found DENV-specific IgG in some serum samples collected more than 60 or even 70 years after primary infection (Imrie et al. 2007; Ngwe Tun et al. 2016). Although IgG antibody is an identified biomarker for previous dengue infection, the neutralizing activity of antibodies and the concentration change are more closely related to the prognosis of DENV infection. Preexisting antibodies, either enhancing or protective, can significantly account for the alternating epidemic pattern and disease dynamics (Olkowski et al. 2013).
Although it was a labor intensive for hundreds of serum samples, the PRNT was still considered as the laboratory standard for testing NAb (Thomas et al. 2009; van Panhuis et al. 2010). In this study, we found that antibodies against DENV-3 were still kept neutralizing activity after a six-year convalescent phase in baseline serosurvey, suggesting that the DENV-3 infection induced a long-lasting humoral immune response against the homologous serotype.
ADE is a well-documented phenomenon where preexisting, non-neutralizing or weakly NAb from the first infection facilitates the subsequent viral entry into FcγR-bearing cells, thereby, intensifying the infection with the second DENV serotype (Wahala and Silva 2011). ADE can be elicited due to lower concentration or less affinity of NAb (Khandia et al. 2018). It had been well documented that difference in ADE activity among DENV serotypes might be due to amino acid variations in antibody binding site (Goncalvez et al. 2007). In addition to affinity, concentration, specificity and isotype of antibodies which are responsible for ADE, the effect can also be affected by other several factors, such as environment, age and autoimmunity (Coffey et al. 2009).
We noticed that, in partial consecutive samples, the titers of NAb in six-year sera increased but not decreased, not only against DENV-3 (13/73) but also against DENV-1, DENV-2 and DENV-4 (13/73, 17/73 and 2/73, respectively). From 2013 to 2017, Jinghong City as well as the whole Xishuangbanna area experienced an almost yearly pattern of DENV introductions with various serotypes. DENV-3 was introduced in 2013 (Zhang et al. 2014), followed by DENV-2 (Jiang et al. 2018) in 2015, DENV-1 and DENV-2 (Sang et al. 2019) in 2016, and DENV-1 (Lin et al. 2019) in 2017. There was no epidemic data for 2018 and 2019. We were not able to reliably classify participant's DENV exposure histories after the dengue outbreak in 2013, but the preexisting exposures more than two DENV serotypes should be taken into consideration. None of participants in this study had hospitalized record of dengue during this period, hence the severe dengue due to the secondary infection could be excluded. Nevertheless, the possibility of the secondary infection with mild symptoms or without symptoms might contribute to the increase of the antibody titers. It was reported that, for those experiencing more than twice DENV infections, the risk for severe disease relative to dengue fever was not various over those experiencing a second DENV infection (Gibbons et al. 2007).
Analysis of repeating hospital admissions pointed out, severe dengue was rare during the third and fourth DENV infections (Gibbons et al. 2007), and the cumulative cross-reactive antibodies contributed to the protective response (Olkowski et al. 2013). Epidemiological data in cohorts illustrated that both NAb and cross-reactive antibodies decreased over time, but the heterotypic response decayed faster (Clapham et al. 2016). Preexisting heterotypic antibodies dramatically reduced but did not eliminate the risk of disease (Olkowski et al. 2013). Consistent with the observations, our data indicated that all the GMT of cross-reactive antibodies decreased in follow-up serosurvey, with a sharp decline of the NAb titer against DENV-4, but the risk of severe diseases with subsequent DENV-4 infection was increased.
Long-term studies found that the severity of disease was determined by the interval between primary and second DENV infection (Guzman et al. 1990). For instance, epidemiological investigation in Nicaragua noted that the window of cross-protection from primary DENV infection to secondary infection was on the order of two years (Montoya et al. 2013). However, a mathematical model predicted that the DHF after heterologous infection was occurred only in five years followed primary infection (Halstead et al. 1970). These data were supported by previous observations that the enhancement of DENV was persisted after four-year convalescent phase in follow-up serosurvey and was declined over two years. To further ascertain the relationship between the ADE effect and convalescent phase, we used the four-year and six-year serum samples in follow-up serosurvey as a reference to estimate the risk of ADE effect over time. We found that the enhancement of sera demonstrated a negative correlation between the risk of secondary infection with DENV-1 or DENV-2 and recover period. Interestingly, the risk of secondary infection with DENV-4 was positively correlated with the increased year after infection.
It is an indisputable fact that, secondary infection with different DENV serotypes or strains are strongly associated with severe diseases (Narayan and Tripathi 2020). Halstead reported that primary DENV-1 infection followed by secondary DENV-2 increased the disease severity (Sangkawibha et al. 1984). In addition, a seroepidemiologic cohort study in Thailand found that, secondary DENV-2 infection appeared more severe grades of DHF than DENV-1, and DENV-2 and DENV-3 had a higher risk of DHF than DENV-4 infection (Fried et al. 2010). Longitudinal data from Vietnam and Thailand recorded that DENV-2 or DENV-4 generally presented to be associated with more severe disease in secondary infection (Clapham et al. 2015; Aguas et al. 2019). In our study, due to the increasing number of ADE positive specimens with DENV-4 in six-year consecutive sera, the risk of enhancement was increased after subsequent infection (Table 5). More detailed comparisons between prediction and practical incidence require longtime series of epidemiological survey.
Age and gender played some roles in dengue disease. The results showed that the incidence of DF was mainly concentrated in population of 31–60 years old and the proportion of male patients was lower than females, which was basically met the demographic distribution of DF in Chinese mainland (Lin et al. 2020). In addition, there was one notable observation that the DENV antibody was evidently declined in population of 41–50 years old with the convalescent phase being prolonged. Actually, in this epidemic in 2013, all the severe cases happened in adults but not children, in stark contrast to the situation in other Asian dengue hyperendemic countries (Zhang et al. 2014). This phenomenon was also the reason for the unbalanced distribution of population samples in this study. The insufficient sample size limited the analysis of the age-stratified incidence. Moreover, more time-points could be added to explore the detail and rule of antibody attenuation and the relationship to the risk of ADE.
As presented in a model of the dynamics of DENV transmission (Cummings et al. 2005), ADE is the most advantageous in environments where multiple serotypes circulate and where a large population is enough to support virus replication during the deep troughs. Although only the high risk conferred by secondary DENV-4 infection was predicted in this study, there are multiple serotypes co-circulating in Jinghong City, and the occurrence of severe dengue in the trough should cause great attention.
In conclusion, the major result of our cohort surveillance concerns the dynamics of antibodies attenuation at different convalescent phases and the forecasted risk of severe disease caused by secondary infection. It suggested that the level of DENV-specific IgG and neutralizing/cross-reactive antibodies decreased with the extension of convalescence, but the risk of ADE caused by secondary infection with DENV-4 was increased in age group of 31–40 years old. Our result offered essential experimental data for antibody monitoring and risk prediction of severe disease in the hyper-endemic dengue areas. Furthermore, it would provide crucial scientific insight for the development of effective vaccine against DENVs.
-
This research was supported by the National Natural Science Foundation of China under grants 81772172, U1902210, 81972979 and 81902048.
-
JA, HC and HNZ conceived and designed the experiments. HNZ, ML, LX, YY and YZ were responsible for sera resources. YSM, ML, LX, NG, DYF, and KHF performed the experiments. YSM, HC and JA analyzed the data. HC and YSM prepared the manuscript draft. HC, JA, and HNZ revised the manuscript. All authors read and approved the final manuscript.
-
The authors declare that they have no conflict of interest.
-
The study protocol was ethically approved by the Ethics Committee of Yunnan Institute of Parasitic Diseases, Pu'er, Yunnan, People's Republic of China (No. 03-"Technical Cooperation Research on Prevention and Control of Emerging Vector-borne Infectious Diseases and Rapid Response and Treatment in the Belt and Road Area"). Informed consents were received from each blood donor, and all participants were notified the purpose of the research and procedures involved in study participation at enrollment.


 DownLoad: