-

-
-
-
Throat swab, antigen detection Result Throat swab, nucleic acid detection Result Serum, antibody detection (IgM) Result Serum, nucleic acid detection Result Influenza A virus Negative Influenza A virus, H7-RNA Negative Legionella pneumophila serum type 1 Negative Cytomegalovirus, DNA < 5.00E+2
Minimal detection limit 5.00E+02Influenza B virus Negative Influenza A virus, N9-RNA Negative Mycoplasma pneumoniae Negative EB virus, DNA < 5.00E+3
Minimal detection limit 5.00E+03Adenovirus Negative Influenza A virus, RNA Negative Q fever Rickettsia Negative Respiratory syncytial virus Negative Influenza A virus H1N1, RNA Negative Chlamydia pneumonia Negative Parainfluenza virus (type 1) Negative Influenza A virus H3N2, RNA Negative Adenovirus Negative Parainfluenza virus (type 2) Negative Influenza B virus, RNA Negative Respiratory syncytial virus Negative Parainfluenza virus (type 3) Negative Parainfluenza virus, RNA Negative Influenza A virus Negative Respiratory syncytial virus, RNA Negative Influenza B virus Negative Metapneumovirus, RNA Negative Parainfluenza virus type 1/2/3 Negative SARS coronavirus, RNA Negative Rhinovirus, RNA Negative Adenovirus, DNA Negative Bocaparvovirus, DNA Negative Pneumonia mycoplasma, DNA Negative Pneumonia chlamydia, DNA Negative Table 1. Laboratory tests for known pathogens of the male patient.
-
Laboratory indices Dec. 28, 2019 Dec. 31, 2019 Jan. 3, 2020 Jan. 10, 2020 Normal range Total white cells (× 109/L) 2.11 ↓ 2.88 ↓ 2.87 ↓ 4.10 3.5–9.5 Neutrophils (× 109/L) 0.99 ↓ 2.15 ↓ 1.50 ↓ 1.93 1.8–6.3 Lymphocytes (× 109/L) 0.89 ↓ 0.49 ↓ 0.92 ↓ 1.57 1.1–3.2 Monocytes (× 109/L) 0.23 0.24 0.42 0.50 0.1–0.6 Eosinophils (× 109/L) 0 0 0.02 0.07 0.02–0.52 C-reactive protein (CRP) (mg/L) 35.43 ↑ 121 ↑ 41.17 ↑ < 0.5 0–10 Serum amyloid A (SAA) (mg/L) 82.77 ↑ 153 ↑ 52.62 ↑ < 5.00 < 10 CD3 (/μL) 273 ↓ 723–2737 CD4 (/μL) 145 ↓ 404–1612 CD8 (/μL) 114 ↓ 220–1129 CD19 (/μL) 52 ↓ 80–616 CD 16 + 56 (/μL) 104 ↓ 84–724 IgG (g/L) 6.26 ↓ 8–16 IgM (g/L) Normal 0.4–3.45 IgA (g/L) Normal 0.76–3.9 IgE (g/L) Normal < 100 C3 (g/L) Normal 0.81–1.6 C4 (g/L) Normal 0.1–0.4 Chief complaints of the patient The fever subsided, but the patient still had cough, chest distress, and dyspnea The patient had no fever, and the cough, chest distress, and dyspnea were slightly improved The symptoms were improved The patient complained of no discomforts Table 2. A summary report of serial blood tests of the male patient, and the chief complains of the patient.
-
Laboratory indices Dec. 31, 2019 Jan. 3, 2020 Jan. 5, 2020 Jan. 8, 2020 Jan. 10, 2020 Normal range Total white cells (× 109/L) 2.83 ↓ 2.41 ↓ 1.58 ↓ 6.29 7.54 3.5–9.5 Neutrophils (× 109/L) 2.07 1.47 ↓ 0.89 ↓ 4.10 6.06 1.8–6.3 Lymphocytes (× 109/L) 0.55 ↓ 0.75 ↓ 0.60 ↓ 1.79 1.07 1.1–3.2 Monocytes (× 109/L) 0.21 0.19 0.09 ↓ 0.39 0.40 0.1–0.6 Eosinophils (× 109/L) 0 ↓ 0 ↓ 0 ↓ 0 ↓ 0 ↓ 0.02–0.52 C-reactive protein (CRP) (mg/L) 19.94 ↑ 10.50 ↑ 25.4 ↑ < 0.5 < 0.5 0–10 Serum amyloid A (SAA)(mg/L) 47.54 ↑ 77.24 ↑ > 300 ↑ 20.52 < 5.00 < 10 CD3 (/μL) 383 ↓ 290 ↓ 1403 723–2737 CD4 (/μL) 176 ↓ 122 ↓ 826 404–1612 CD8 (/μL) 182 ↓ 142 ↓ 537 220–1129 CD19 (/μL) 41 ↓ 79 ↓ 326 80–616 CD 16 + 56 (/μL) 23 ↓ 42 ↓ 26 ↓ 84–724 IgG (g/L) Normal Normal Normal 8–16 IgM (g/L) Normal Normal Normal 0.4–3.45 IgA (g/L) Normal Normal Normal 0.76–3.9 IgE (g/L) Normal Normal Normal < 100 C3 (g/L) Normal Normal 0.728 ↓ 0.81–1.6 C4 (g/L) Normal Normal 0.063 ↓ 0.1–0.4 Chief complaints of the patient Fever, cough, and vomiting Still fever, cough, and diarrhea (passing watery stools) The fever subsided, the diarrhea disappeared, and the cough lasted The fever and diarrhea disappeared, and the cough was improved The patient complained of no discomforts Table 3. A summary report of serial blood tests of the female patient, and the chief complains of the patient.
-
IgM Cut-off value IgG Cut-off value Male patient 0.530 ≥ 0.2 1.770 ≥ 0.15 Female patient 1.645 ≥ 0.2 1.433 ≥ 0.15 Table 4. Coronavirus IgM and IgG detection in patients
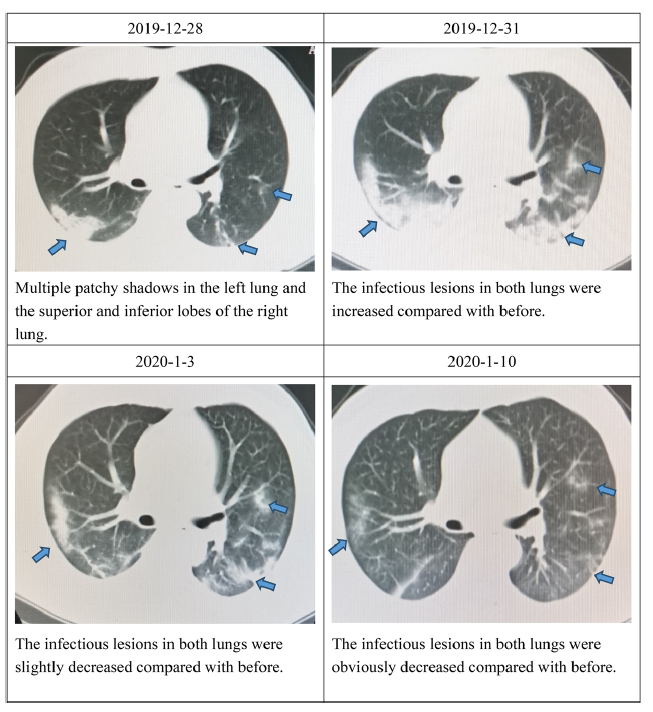
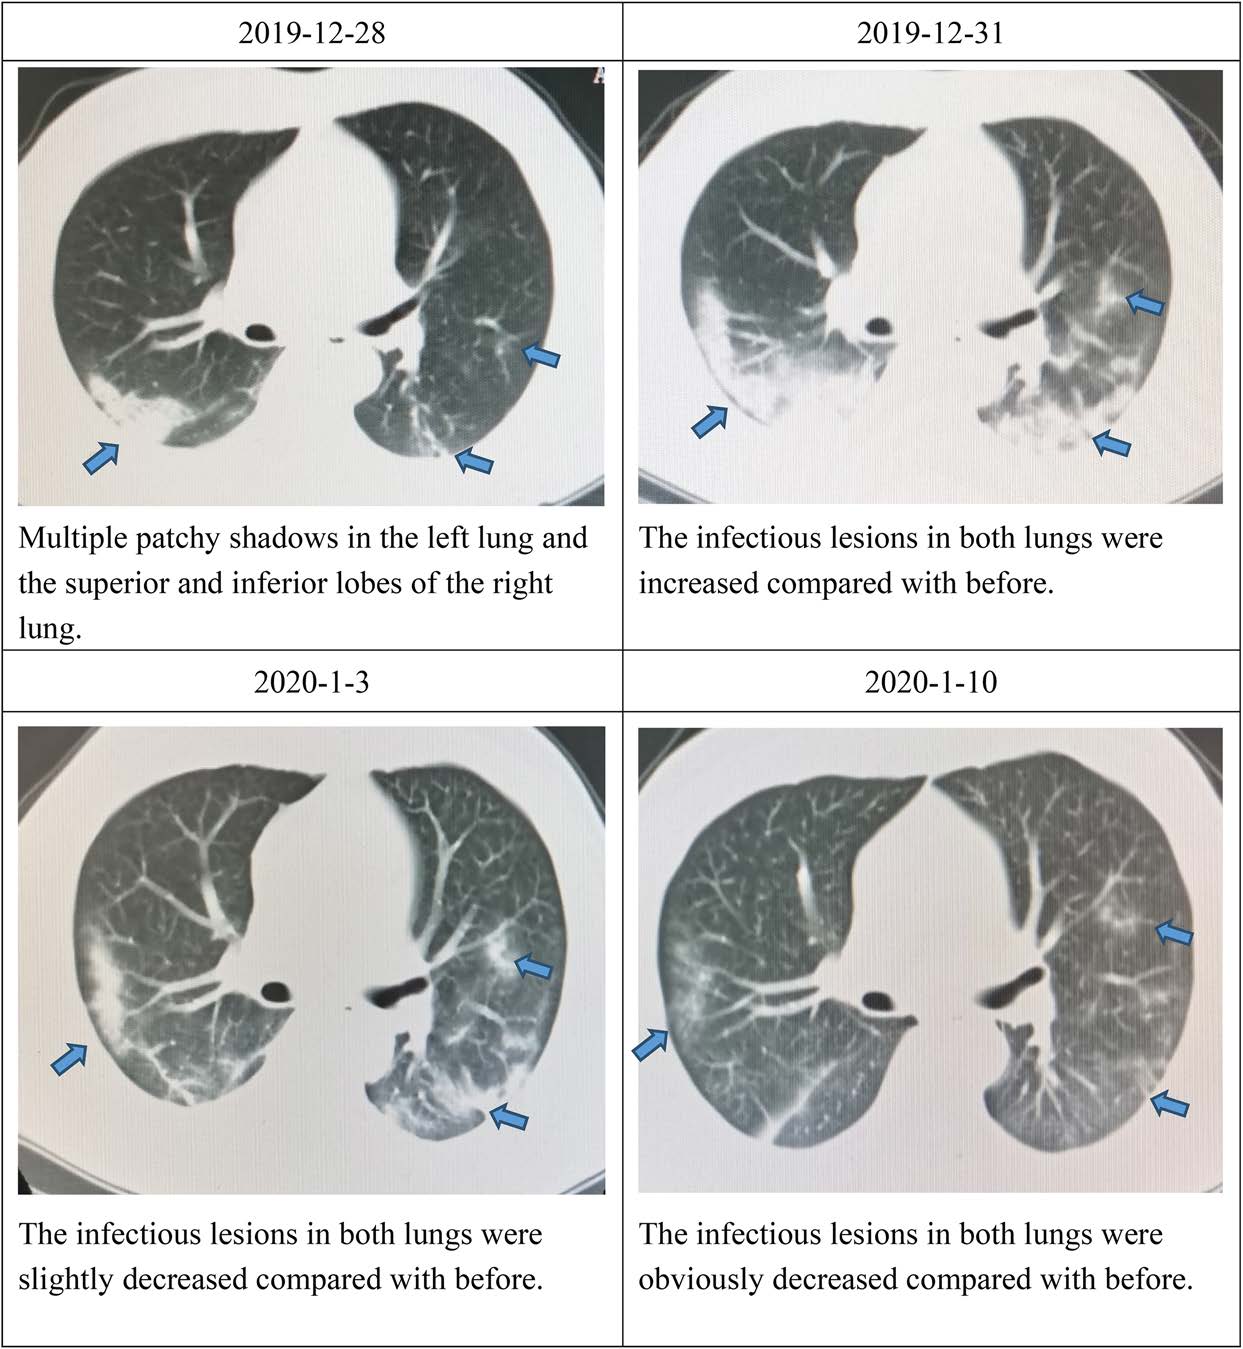
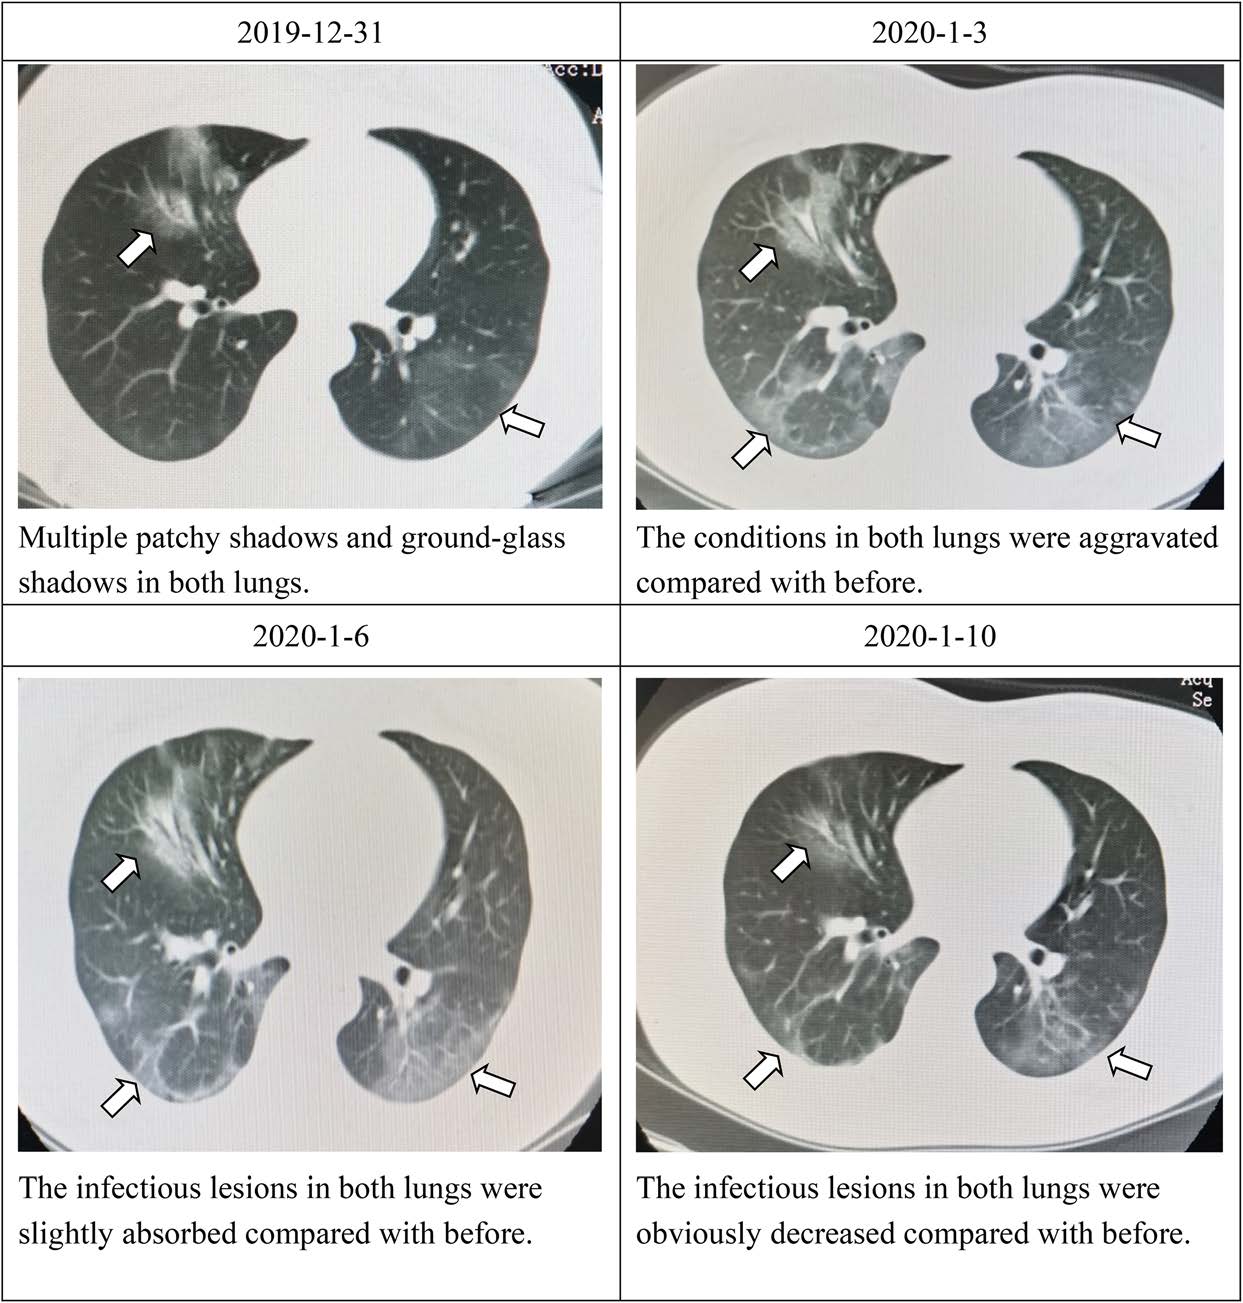
Figure 3 个
Table 4 个