-
-
Example* log of virus dilution Positive units/Total units Cumulative positive (A) Cumulative negative (B) Infected rate (%) A/(A+B) Case 1 -5 5/5 9 
0 
100 -6 3/5 4 2 66.7 -7 1/5 1 6 14.3 -8 0/5 0 11 0 Case 2 -1 8/8 24 0 100 -2 7/8 16 1 94.12 -3 5/8 9 4 69.23 -4 3/8 4 9 30.77 -5 1/8 1 16 5.88 Case 3 -3 6/6 27 0 100 -4 6/6 21 0 100 -5 6/6 15 0 100 -6 5/6 9 1 90 -7 3/6 4 4 50 -8 1/6 1 9 10 aCase 1 was derived from Table A1 in Burleson et al. (1992); case 2 from Table 2.1 in Hierholzer and Killington (1996); and case 3 from Figure 1 in Svensson et al. (1999) Table 1. Sample datasets used to calculate the 50% endpoint using the Reed–Muench method
-
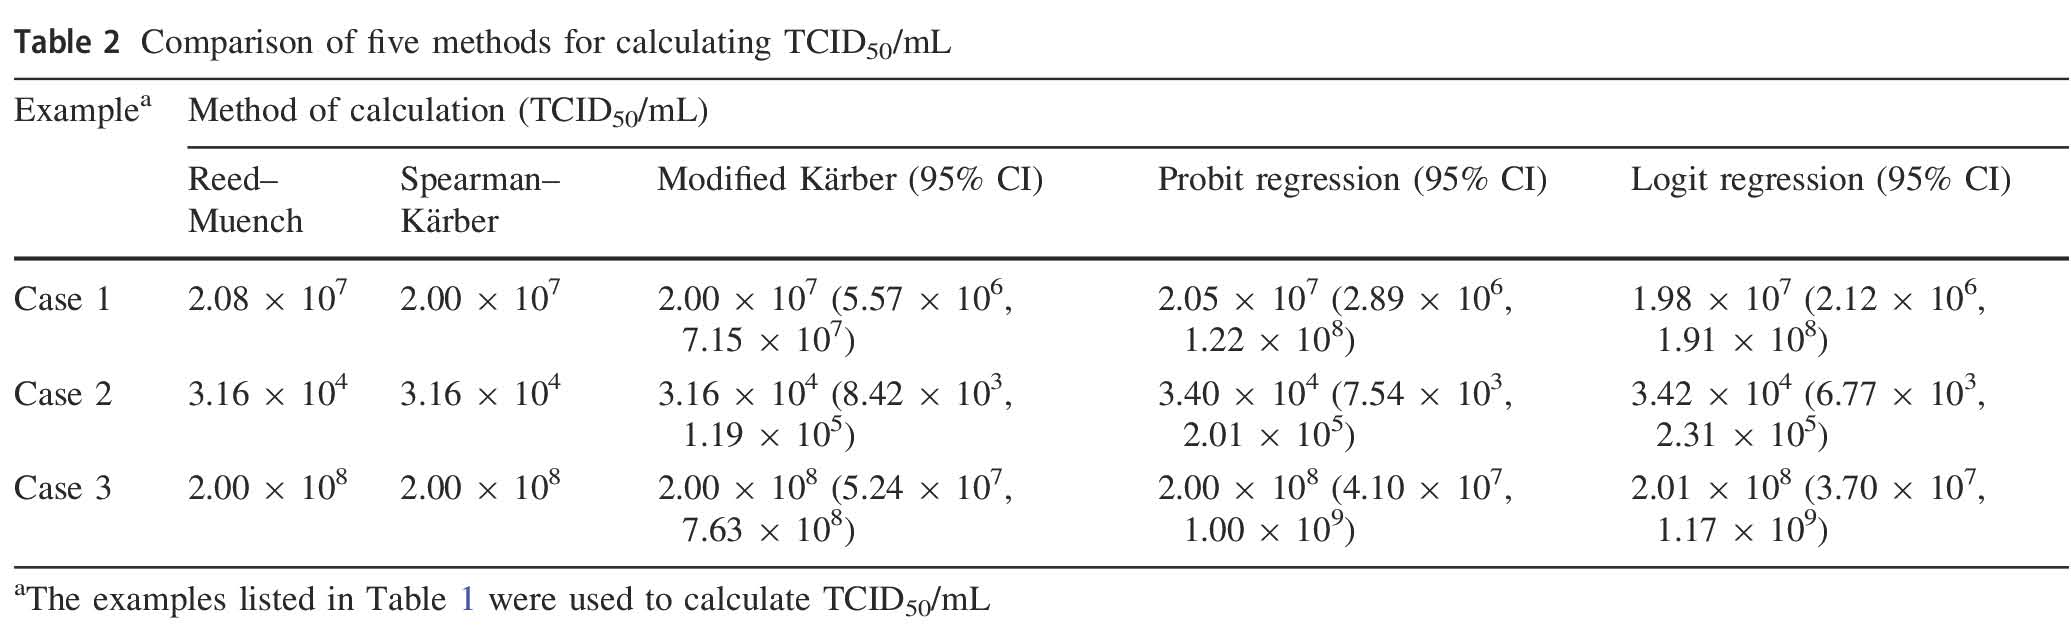
Examplea Method of calculation (TCID50/mL) Reed–Muench Spearman–Kärber Modified Kärber (95% CI) Probit regression (95% CI) Logit regression (95% CI) Case 1 2.08 × 10⁷ 2.00 × 10⁷ 2.00 × 10⁷ (5.57 × 10⁶, 7.15 × 10⁷) 2.05 × 10⁷ (2.89 × 10⁶, 1.22 × 10⁸) 1.98 × 10⁷ (2.12 × 10⁶, 1.91 × 10⁸) Case 2 3.16 × 10⁴ 3.16 × 10⁴ 3.16 × 10⁴ (8.42 × 10³, 1.19 × 10⁵) 3.40 × 10⁴ (7.54 × 10³, 2.01 × 10⁵) 3.42 × 10⁴ (6.77 × 10³, 2.31 × 10⁵) Case 3 2.00 × 10⁸ 2.00 × 10⁸ 2.00 × 10⁸ (5.24 × 10⁷, 7.63 × 10⁸) 2.00 × 10⁸ (4.10 × 10⁷, 1.00 × 10⁹) 2.01 × 10⁸ (3.70 × 10⁷, 1.17 × 10⁹) aThe examples listed in Table 1 were used to calculate TCID50/mL Table 2. Comparison of five methods for calculating TCID50/mL
Figure 1 个
Table 2 个