-
-
-
-
-
-
-
-
Patient Test (n) Ct value of RPP30 ≤ 21.53 21.53–24.47 > 24.47 SARS-CoV-2 RNA (N or ORF1ab region) +/+ ± −/− +/+ ± −/− +/+ ± −/− P1 4 1 1 2 P2 6 1 3 2 P3 11 1 3 4 1 2 P4 5 1 2 2 P5 8 3 1 2 2 P6 7 1 3 1 2 P7 7 4 2 1 P8 10 2 3 5 P9 12 2 5 1 2 2 P10 5 2 1 1 1 P11 3 2 1 P12 7 3 2 1 1 P13 7 4 2 1 P14 13 5 5 3 P15 4 1 1 1 1 Total 109 31 1 21 28 3 3 22 Table 1. Correlation between Ct values of RPP30 and detection results of SARS-CoV-2 RNA in sputums
-
Patient Test (n) Ct value of RPP30 ≤ 25.53 25.53–27.48 > 27.48 SARS-CoV-2 RNA (N or ORF1ab region) +/+ ± −/− +/+ ± −/− +/+ ± −/− W1 7 2 3 2 W2 14 4 1 9 W3 5 1 1 1 2 W4 6 1 2 1 2 W5 6 1 2 3 W6 9 1 1 1 1 1 4 W7 7 1 1 1 4 W8 5 2 1 1 1 W9 10 2 1 1 6 W10 3 1 1 1 Total 72 10 1 4 16 4 1 2 34 Table 2. Correlation between Ct values of RPP30 and detection results of SARS-CoV-2 RNA in throat swabs
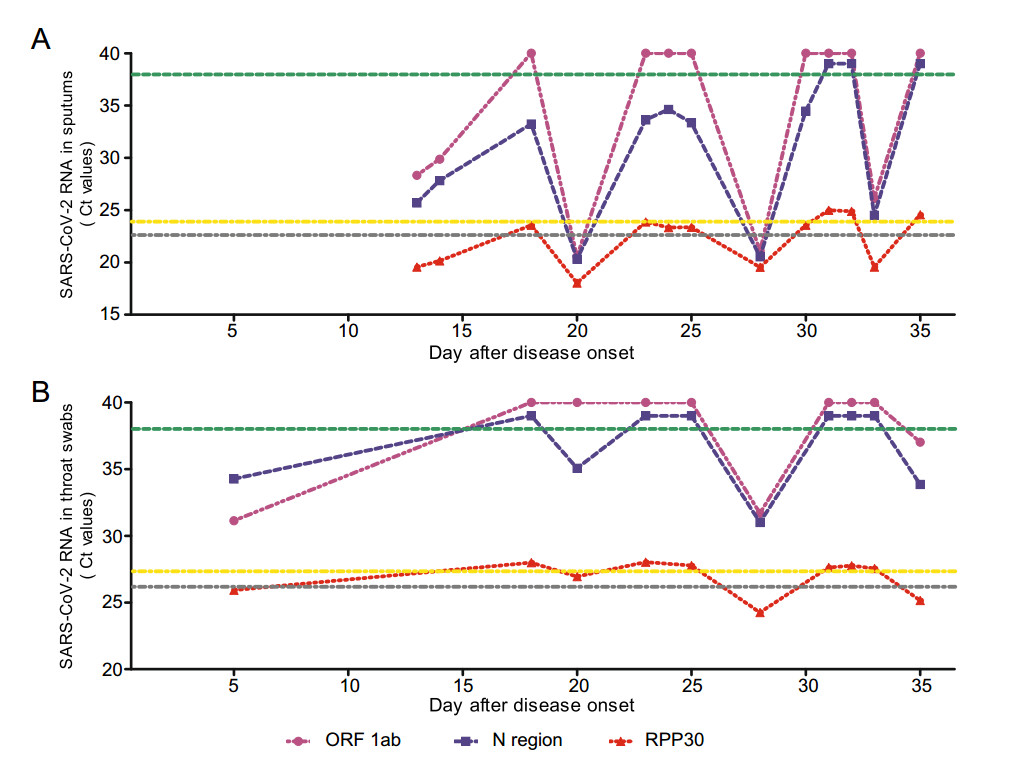
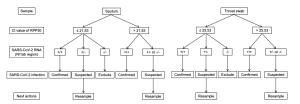
Figure 7 个
Table 2 个