-

-
-
-
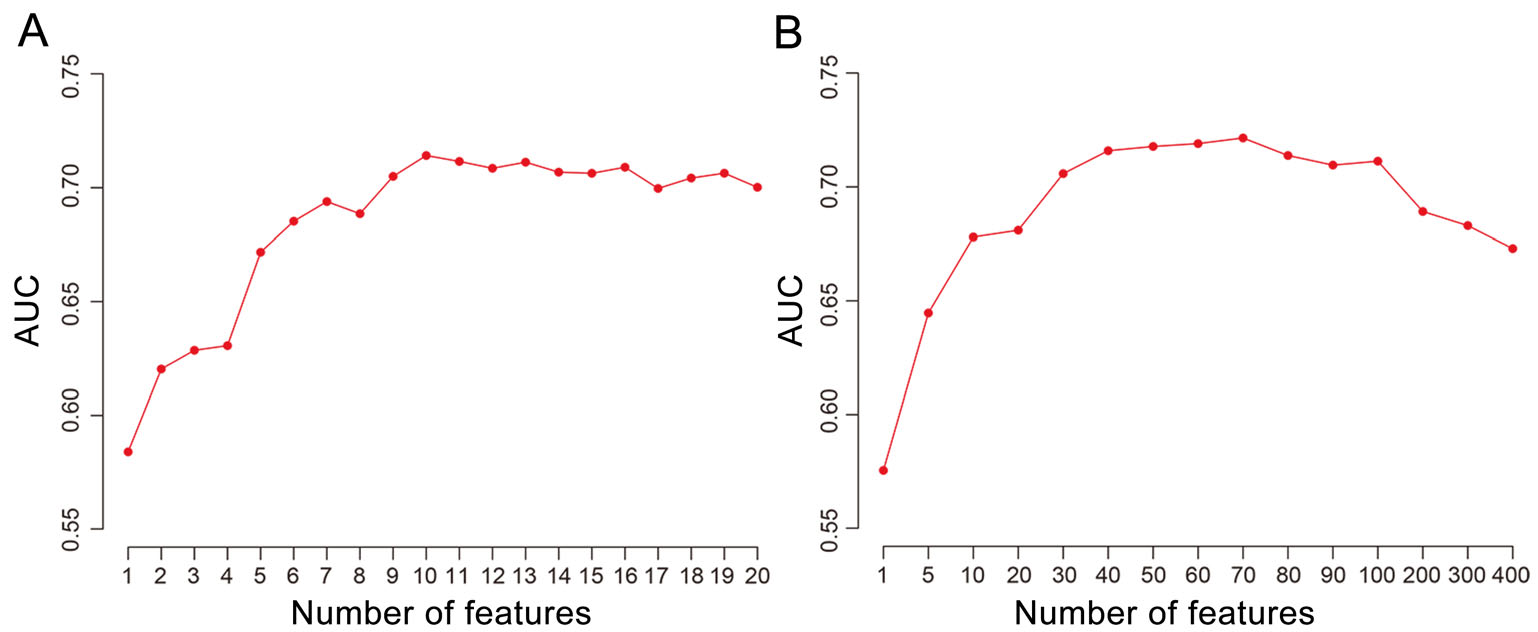
Model with different sets of features Feature number Acc Sen Spe AUC N-gly 1 0.59 0.58 0.59 0.59 PPI 1 0.62 0.60 0.62 0.61 Expression 1 0.50 0.51 0.50 0.51 N-gly + PPI + Expression 3 0.72 0.68 0.72 0.70 AAC (top 10) 10 0.70 0.73 0.70 0.71 N-gly + PPI + Expression + AAC (top10) 13 0.76 0.75 0.76 0.76 N-gly N-glycosylation, PPI node degree in human PPI network, Expression expressions in 32 human tissues, AAC amino acid composition, Acc accuracy, Sen sensitivity, Spe specificity, AUC area under receiver operating characteristic curve. Table 1. The predictive performances of random-forest models using different sets of features.
-
Gene name Protein name RF score Gene name Protein name RF score ITGAV Integrin alpha-V 0.959 PTPRJ Receptor-type tyrosine-protein phosphatase eta 0.903 SCARB1 Scavenger receptor class B member 1 0.948 KDR Vascular endothelial growth factor receptor 2 0.903 NCAM1 Neural cell adhesion molecule 1 0.943 IL6ST Interleukin-6 receptor subunit beta 0.900 ITGB1 Integrin beta-1 0.940 SELP P-selectin 0.898 IGF2R Cation-independent mannose-6-phosphate receptor 0.928 HSPA8 Heat shock cognate 71 kDa protein 0.895 ITGA6 Integrin alpha-6 0.927 EGFR Epidermal growth factor receptor 0.895 HLA-DRA HLA class Ⅱ histocompatibility antigen, DR alpha chain 0.926 TNFRSF14 Tumor necrosis factor receptor superfamily member 14 0.895 ITGA3 Integrin alpha-3 0.914 IL7R Interleukin-7 receptor subunit alpha 0.892 CR2 Complement receptor type 2 0.911 KIT Mast/stem cell growth factor receptor Kit 0.891 LDLR Low-density lipoprotein receptor 0.911 SLAMF1 Signaling lymphocytic activation molecule 0.891 Table 2. Top 20 human cell membrane proteins and their scores assigned by the random-forest model.
-
Virus name RBP Real viral receptor Num of RBP-interacting proteins Rank by LR Rank by RF score SARS-CoV S ACE2 31 –* 22 MERS-CoV S DPP4 8 – 2 Echovirus E6 VP1 CD55 13 5 2 Echovirus E11 VP1 CD55 9 4 2 Echovirus E7 VP1 CD55 7 – 3 Echovirus E13 VP1 CD55 11 4 1 Echovirus E20 VP1 CD55 12 5 1 Echovirus E29 VP1 CD55 13 6 2 Echovirus E33 VP1 CD55 13 6 1 Enterovirus C VP1 PVR 5 – 1 Hepacivirus C E1 EGFR 17 10 2 MACV GPC TFRC 2 – 1 Measles virus H NECTIN4 18 – 18 Measles virus H SLAMF1 18 2 2 Hendra virus G EFNB2 5 – 1 Nipah virus G EFNB2 5 – 1 HAdV-A L5 CXADR 25 – 16 HAdV-C L5 CXADR 5 4 5 HAdV-D L5 CXADR 28 4 15 HAdV-E L5 CXADR 33 3 24 HSV-1 US6 TNFRSF14 28 – 3 HSV-1 US6 NECTIN1 28 – 11 HSV-2 US6 NECTIN1 34 – 14 HSV-2 US6 TNFRSF14 34 23 3 HIV-1 env CD4 21 – 1 Top 1 0 8 (3)# Top 3 2 17 (9)# Top 5 8 18 (10)# Median rank percentage 0.43 0.20 (0.14)# The median rank percentage of real virus receptors among RBP-interacting human cell membrane proteins, and the number of real virus receptors among top one, three and five ranks were summarized at the bottom.
MACV machupo mammarenavirus, HAdV-A human mastadenovirus A, HAdV-C human mastadenovirus C, HAdV-E human mastadenovirus E, HAdV-D human mastadenovirus D, HSV-1 human alphaherpesvirus 1, HSV-2 human alphaherpesvirus 2, HIV-1 human immunodeficiency virus 1.
*No LR was provided in Lasso's work since there were resolved complex structures between the RBP and the receptor.
#The number in brackets referred to those when only considering 12 pairs of viral RBP-receptor interaction with LRs available from Lasso's work.Table 3. The ranks of real virus receptors among the RBP-interacting human cell membrane proteins by likelihood ratio (LR) and random-forest (RF) score.
Figure 3 个
Table 3 个