-
-
-
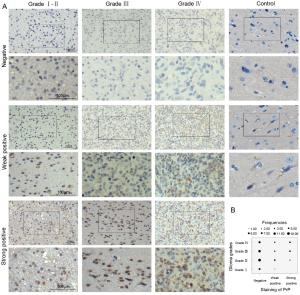
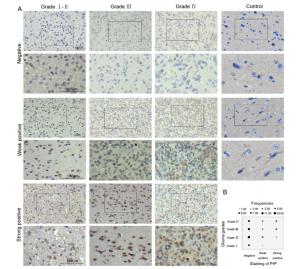
Brain samples Strong positive Weak positive Negative HGG (n = 34)* 10 (29.4%) 6 (17.6%) 18 (52.9%) LGG (n = 32) 2 (6.3%) 6 (18.8%) 24 (75%) Control brain (n = 15) – 1 (6.7%) 14 (93.3%) HGG high-grade glioma, LGG low-grade glioma, IHC immunohistochemistry. Statistical analysis carried out using Mann–Whitney U test is shown as *P < 0.05, compared with LGG Table 1. Summary of IHC data for PrP detection in glioma and control brain tissues
Figure 2 个
Table 1 个

