-
-

-
Type of HIV protein Western blot band pattern No. subjects No. subjects receiving follow-up Follow-up outcomes No. of negative HIV antibodies No. of positive HIV antibodies No. of indeterminate HIV antibodies Env gp160 30 26 19 6 1 gp160 + p24 37 29 2 25 2 gp160 + gp120 9 7 2 4 1 gp160 + gp120 + gp41 15 6 0 4 2 gp160 + p24 + p17 2 2 0 2 0 gp160 + p55 + p51 1 1 1 0 0 gp160 + p66 + p51 + p24 1 1 0 1 0 gp120 1 0 0 0 0 gp41 1 1 1 0 0 gp41 + p24 1 1 1 0 0 Total 98 74 26 42 6 Gag p24 93 71 57 11 3 p24 + p17 4 3 3 0 0 p17 10 6 5 0 1 Total 107 80 65 11 4 Pol p51 3 1 0 1 0 p66 1 1 1 0 0 p66 + p51 1 1 1 0 0 Total 5 3 2 1 0 Total 210 157 93 54 10 Table 1. Western blot band patterns and follow-up outcomes in patients with HIV-indeterminate Western blot results.
-
Western blot band pattern No. subjects No. subjects receiving follow-up Follow-up outcomes No. of negative HIV antibodies (%) No. of positive HIV antibodies (%) No. of indeterminate HIV antibodies Single band 139 106 83 (78.30%) 18 (16.98%) 5 Double bands 52 41 9 (21.95%) 29 (70.73%) 3 Three bands or more 19 10 1 (10%) 7 (70%) 2 Total 210 157 93 54 10 Table 2. Follow-up outcomes for HIV-indeterminate western blot samples with different numbers of Western blot bands.
-
Western blot P24 antigen detection Quantitative HIV nucleic acid test Qualitative HIV nucleic acid test Total + - + - + - + 23 (42.59%) 31 (57.41%) 52 (96.3%) 2 (3.7%) 51 (94.44%) 3 (5.56%) 54 - 3 (3.23%) 90 (96.77%) 9 (9.68%) 84 (90.32%) 2 (2.15%) 91 (97.85%) 93 Total 26 121 61 86 53 94 147 Table 3. Performance of different assays for the differential diagnosis of HIV-indeterminate Western blot samples.
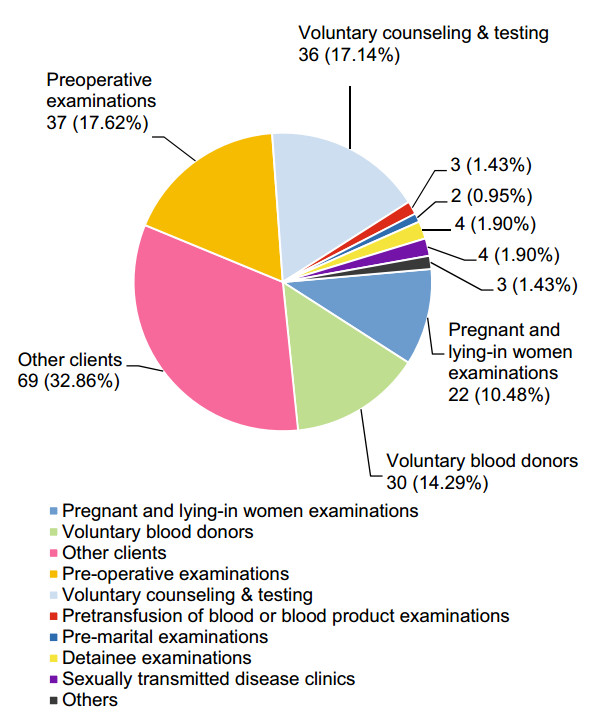
Figure 2 个
Table 3 个