-

-
Chinese porcine kobuvirus strains Global porcine kobuvirus strains A T/U C G A T/U C G A - 1.94 1.78 6.07 A - 1.97 1.80 7.25 T/U 1.70 - 34.89 1.41 T/U 1.71 - 33.54 1.43 C 1.70 38.10 - 1.41 C 1.71 36.71 - 1.43 G 7.29 1.94 1.78 - G 8.67 1.97 1.80 - Analysis of the new Sichuan porcine kobuvirus strains, reference Chinese strains and global strains. Each entry is the probability of substitution (r) from one base (row) to another base (column). The rates of different transition substitutions are shown in bold and those of transversion substitutions are shown in italics. Table 1. Maximum likelihood estimate of substitution matrix
-
Pig age diarrhea non-diarrhea Total Infection rates (%) Suckling pigs 56 15 71 59.17 Weaned pigs 24 9 33 27.50 Growing pigs 11 5 16 13.33 Total 91 29 120 - Infection rates (%) 75.83 24.17 - - Table S1. Statistical analysis of samples infected with porcine kobuvirus.
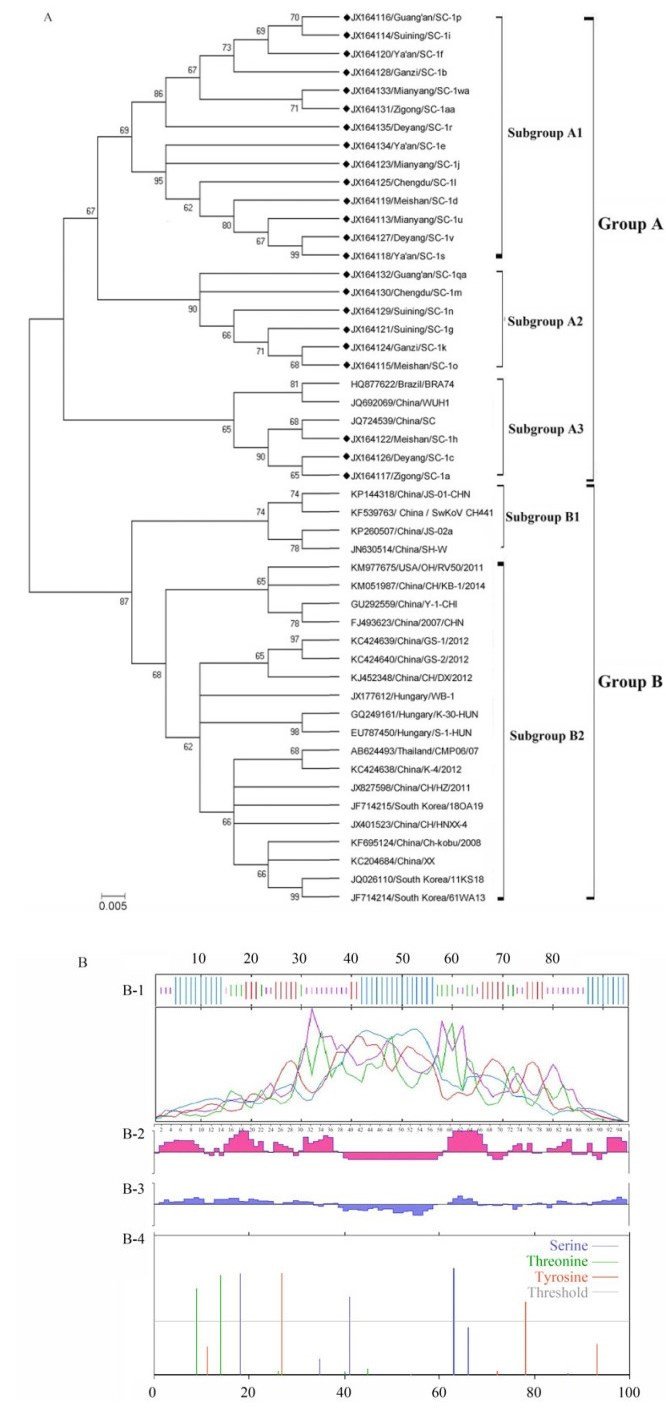
Figure 1 个
Table 2 个