-
-
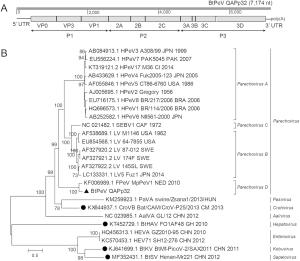
ORF/region QAPp32 HPeVNII561-2000
(AB252582)LV 87-012G
(EF202833)SEBV
(NC021482)FPeVNED 2010
(KF006989)nt aa nt % aa % nt % aa % nt % aa % nt % aa % VP0 726 242 867 42.2 289 34.3 777 48.7 259 39.9 777 49.9 259 39.0 726 70.0 242 77.3 VP3 693 231 756 46.4 252 38.3 732 51.2 244 44.3 729 48.5 243 41.0 693 68.9 231 81.0 VP1 771 257 702 44.0 234 34.6 951 41.3 317 28.7 930 41.8 310 31.5 771 70.8 257 74.0 P1 2190 730 2325 45.6 775 35.3 2460 46.6 820 36.9 2436 46.3 812 36.5 2190 69.9 730 77.3 2A 627 209 450 37.4 150 28.0 405 35.6 135 31.1 402 34.0 134 30.6 627 75.6 209 68.6 2B 408 136 366 47.9 122 36.0 414 54.5 138 41.8 411 48.1 137 40.1 408 72.5 136 80.3 2C 993 331 987 53.2 329 41.7 999 55.1 333 44.7 999 52.7 333 43.7 993 74.0 331 83.7 P2 2028 676 1803 47.7 601 36.8 1818 49.7 606 40.3 1812 46.3 604 39.4 2028 74.5 676 78.7 3A 330 110 351 40.8 117 22.0 390 39.5 130 15.4 372 43.0 124 21.0 330 66.4 110 71.8 3B 90 30 60 34.4 20 37.5 87 49.5 29 34.4 87 53.3 29 43.3 90 74.4 30 90.0 3C 582 194 600 48.8 200 36.3 594 50.4 198 38.9 582 50.9 194 36.6 582 75.4 194 86.6 3D 1401 467 1407 51.5 469 41.7 1410 52.9 470 44.4 1410 52.3 470 43.7 1401 72.9 467 80.7 P3 2403 801 2418 49.4 806 37.0 2481 50.1 827 38.6 2451 50.5 817 38.8 2403 72.6 801 81.3 Polyprotein 6624 2207 6549 47.8 2182 36.5 6762 51.3 2253 39.6 6702 50.3 2233 39.4 6624 72.4 2207 79.3 The highest identities are indicated in bold.
nt, nt length; %, identity; aa, aa length.Table 1. Comparison of amino acid and nucleotide sequence identity between QAPp32 and other representative parechoviruses.
Figure 1 个
Table 1 个
