-
-
-
-
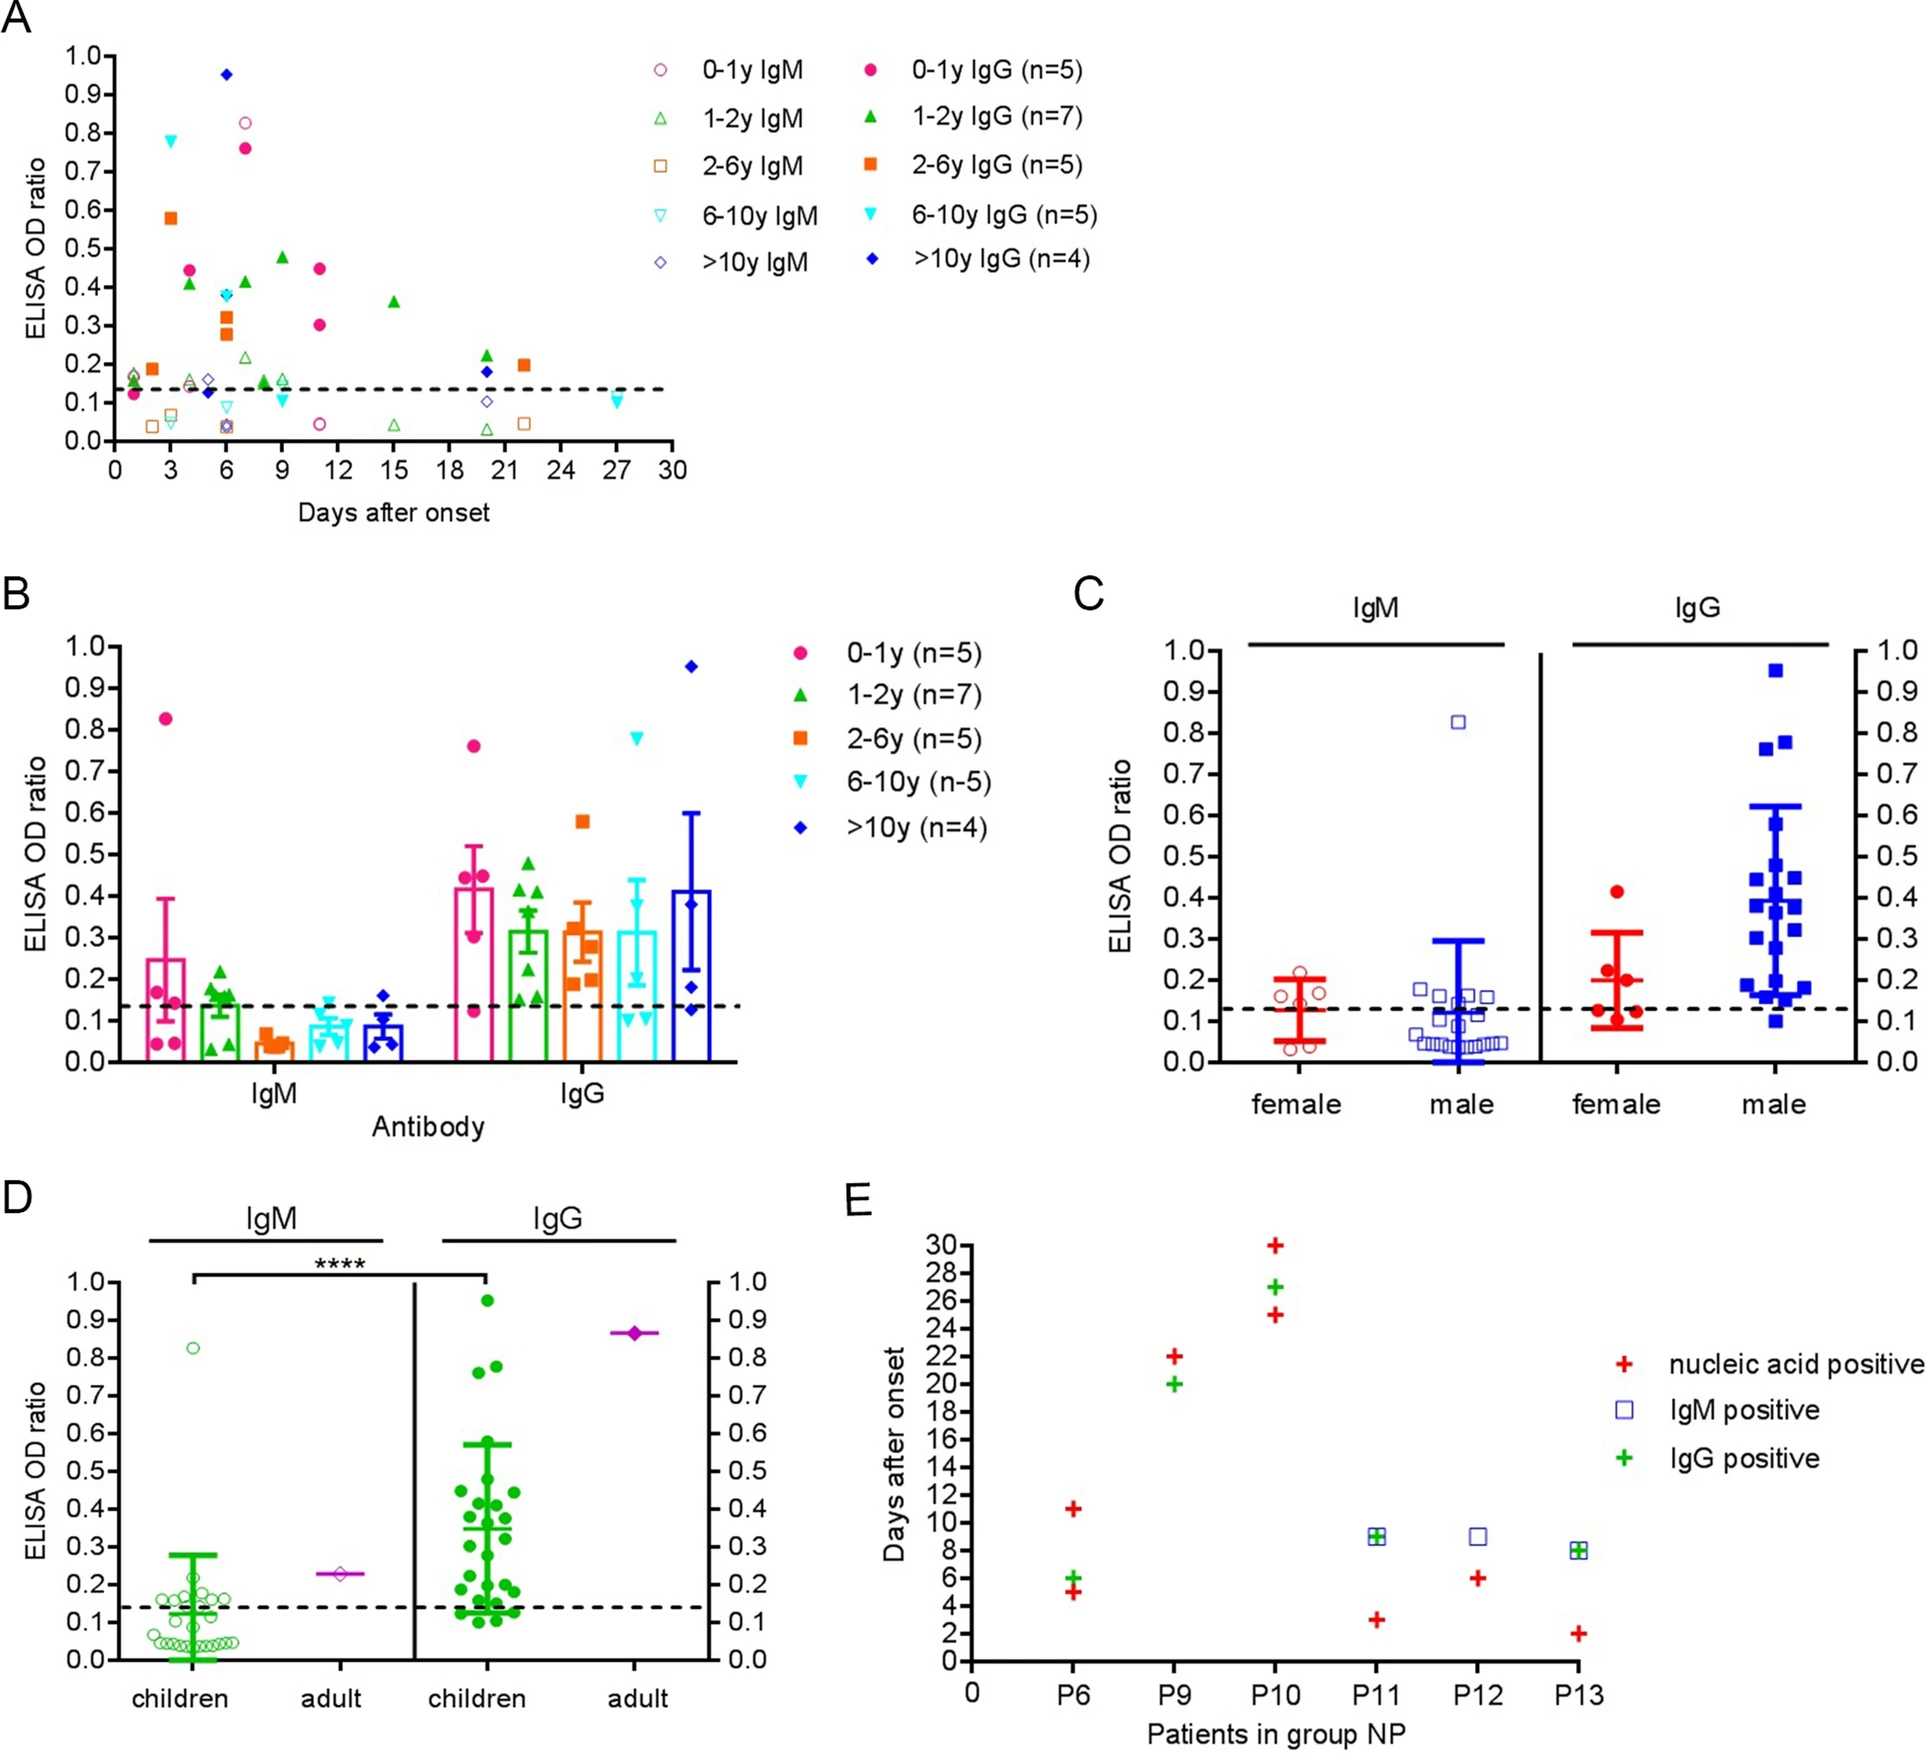
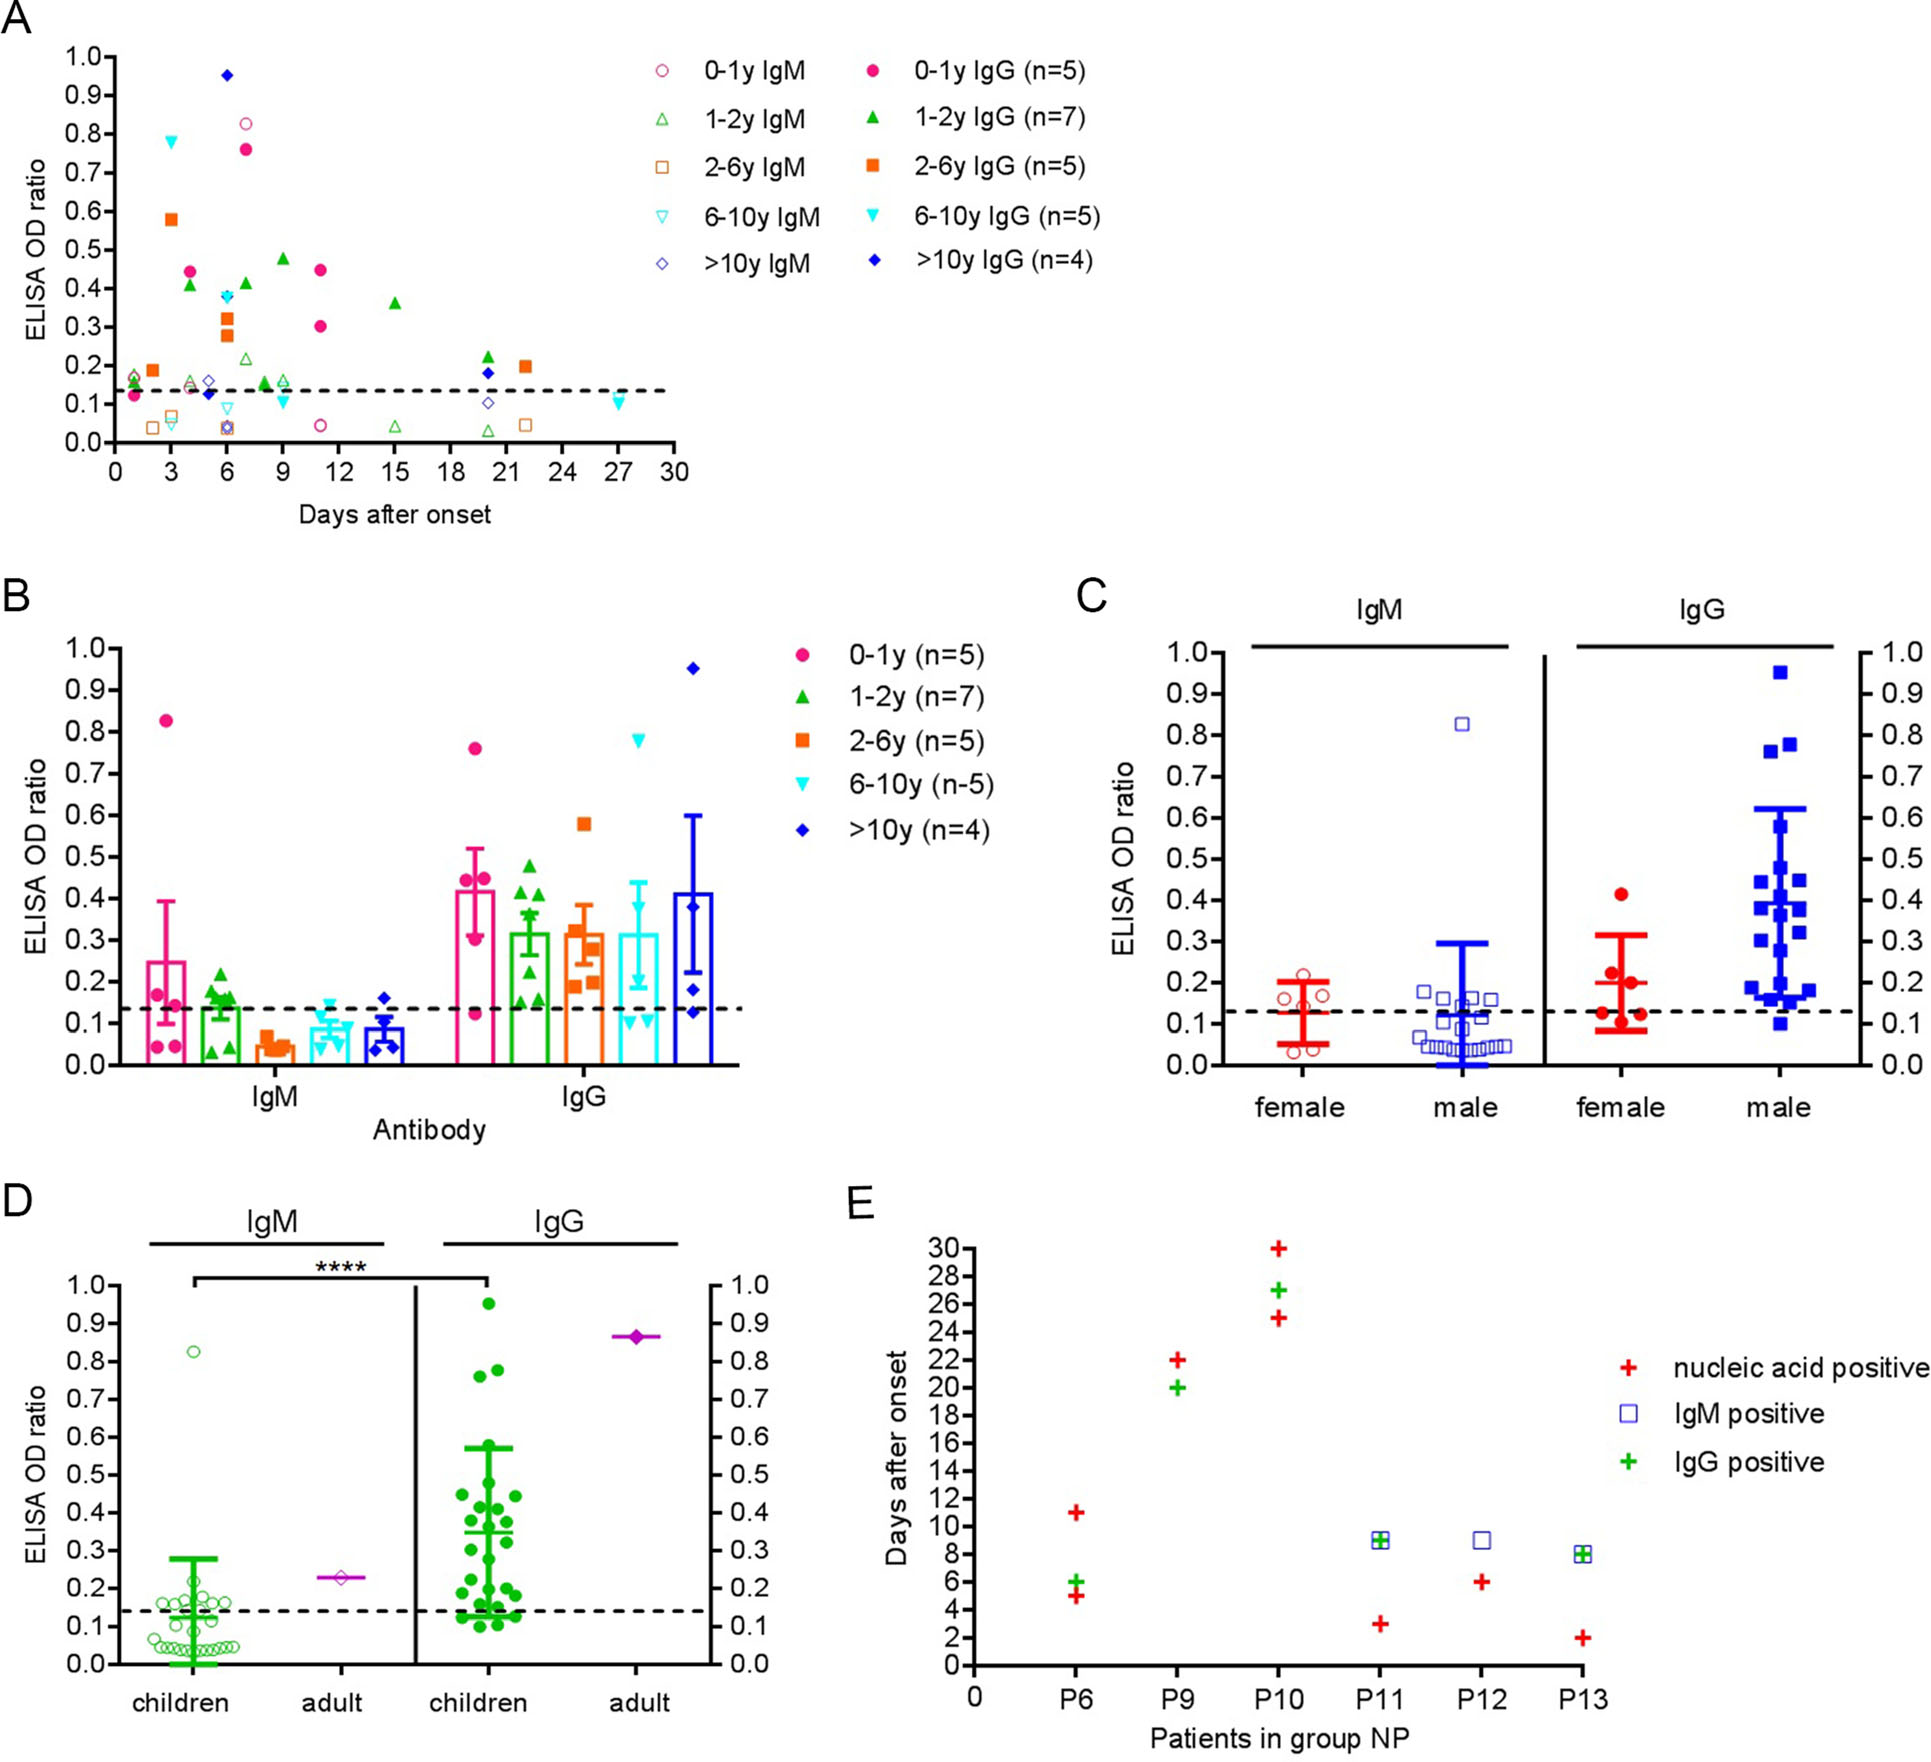
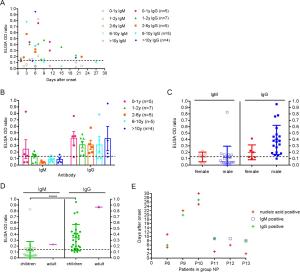
Characteristic Total (n = 34) Group NP (n = 14) Group AP (n = 20) SARS-CoV-2 RNA, No (%) 14 (41.2) 14/14 (100.0)* 0* SARS-CoV-2 antibody, No (%) Ig M (+) and / or IgG (+) 26 (100.0) 6/6 (100.0) 20 (100.0) Only Ig M (+) 3 (11.5) 1/6 (16.7) 2 (10.0) Only IgG (+) 16 (61.5) 3/6 (50.0)* 13 (65.0)* IgM (+) and Ig G (+) 7 (26.9) 2/6 (33.3) 5 (25.0) *Refers to a statistically significant difference between group NP and group AP, P < 0.05. Table 1. SARS-CoV-2 nucleic acid and antibody detection of 34 patients.
-
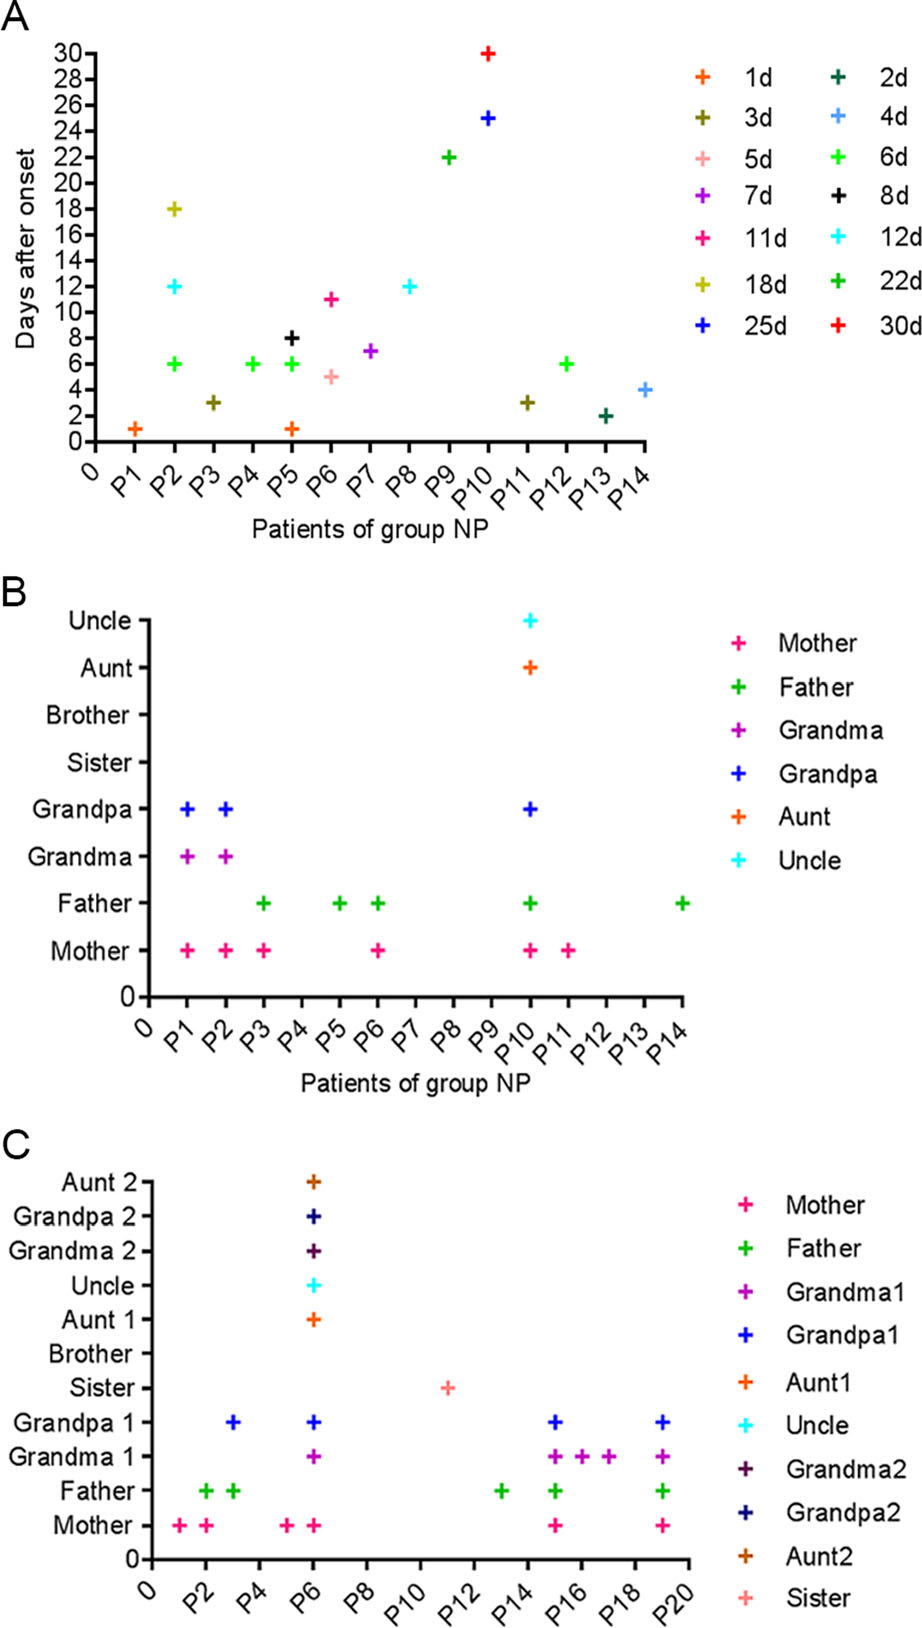
Characteristic Total (n = 34) Group NP (n = 14) Group AP (n = 20) Age, y, median (IQR) 5.0 (1.0–9.0) 5.6 (1.1–9.0) 4.5 (0.9–9.4) Age distribution, No. (%) 0–1 years 8 (23.5) 3 (21.5) 5 (25.0) 1–2 year 8 (23.5) 2 (14.3) 6 (30.0) 2–6 years 3 (8.8) 1 (7.1) 2 (10.0) 6–10 years 10 (29.4) 7 (50.0) 3 (15.0) > 10 years 5 (14.7) 1 (7.1) 4 (20.0) Gender, No. (%) Female 10 (29.4) 4 (28. 6) 6 (30.0) Male 24 (70.6) 10 (71.4) 14 (70.0) Familial cluster, No. (%) 19 (55.9) 8 (57.1) 11 (55.0) Breast feeding, No. (%) (< 1y) 
6/8 (75.0) 3/3 (100.0) 3/5 (60.0) Coexisting disorder, No. (%) 1 (2.9) 0 1 (5.0) Clinical classification Common 30 (88.2) 13 (92.9) 17 (85.0) Severe 4 (11.8) 1 (7.1) 3 (15.0) Time from illness onset to hospital, ds, median (IQR) 15.8 (9.0–19.3) 18.4 (9.8–24.3) 14.0 (9.0–16.3) Symptoms and signs, No. (%) Fever 24 (70.6) 10 (71.4) 14 (70.0) Cough 28 (82.4) 13 (92.6) 15 (75.0) Sputum production 15 (44.1) 6 (42.9) 9 (45.0) Shortness of breath 4 (11.8) 1 (7.1) 3 (15.0) Cyanosis 1 (2.9) 1 (7.1) 0 Sore throat 3 (8.8) 1 (7.1) 2 (10.0) Running nose 8 (23.5) 4 (28.6) 4 (20.0) Vomiting 4 (11.8) 0 4 (15.0) Diarrhea 2 (5.9) 1 (7.1) 1 (5.0) Blood routine, (normal; × 109/L), median (IQR) Leukocyte count, (5.5–12.0) 8.2 (6.1–9.7) 6.1 (4.9–7.7)* 9.7 (6.7–11.5)* Neutrophil count, (1.1–3.9) 4.5 (2.1–5.5) 2.9 (1.4–4.4)* 5.6 (3.1–7.8)* Lymphocyte count, (1.2–6.0) 3.0 (1.5–4.2) 2.5 (1.4–3.1) 3.3 (1.8–4.6) < 1.2, No. (%) 4 (11.8) 1 (7.1) 3 (15.0) 1.2–6.0, No. (%) 26 (76.5) 12 (85.7) 14 (70.0) > 6.0, No. (%) 4 (11.8) 1 (7.1) 3 (15.0) Platelet count, (100–300) 255 (158–325) 252 (144–300) 257 (165–333) Infection-related biomarkers (normal range), median (IQR) C-reactive protein, (0–10.0 mg/L) 9.4 (0.3–11.6) 3.7 (0–8.5) 13.5 (2.0–15.4) > 10, No. (%) 9 (26.5) 3 (21.4) 6 (30.0) Procalcitonin, (< 0.05 ng/mL)a 0.7(0.1–0.9) 0.1 0. 8 (0.1–0.9) > 0.05, No. (%) 11 (78.6) 1/1 (100.0) 10 / 13 (76.9) Humoral immunity, (normal; g/L), median (IQR)b IgA, (0.14–2.7) 1.0 (0.2–1.3) 1.3 (0.27–2.2) 0.7 (0.17–1.24) IgM, (0.15–2.6) 1.0 (0.6–1.3) 1.0 (0.5–1.6) 0.9 (0.7–1.3) IgG, (3.0–16.5) 7.8 (6.4–10.9) 8.1 (5.2–11.6) 7.6 (6.5–10.5) Liver and kidney function, (normal range), median (IQR) ALT, (5–40 U/L) 23.0 (13.4–27.3) 22.8 (12.4–28.4) 23.0 (14.9–27.5) AST, (8–40 U/L) 35.5 (25.6–43.0) 35.1 (25.0–44.1) 35.8 (26.1–43.7) TB, (1.71–17.1 μmol/L) 6.1 (3.4–7.9) 5.8(3.5–7.1) 6.3(3.2–9.1) BUN, (2.9–7.1 mmol/L) 3.7 (2.9–4.5) 3.6(3.1–4.6) 3.7 (2.8–4.5) CRE, (30–106 μmol/L) 32.0 (22.0–42.0) 35.25 (24.1–47.8) 30.4 (22.0–36.5) Co-infection, No. (%) Mycoplasma—IgG (≥ 1:160) 14 (41.2) 5 (35.7) 9 (45.0) Influenza virus A-RNA (+) 1 (2.9) 0 1 (5.0) Respiratory syncytial virus-RNA (+) 6 (17.6) 4 (28.6) 2 (10.0) Epstein-Barr virus-DNA (+) 1 (2.9) 1 (7.1) 0 Sputum culture for streptococcus pneumonia 1 (2.9) 1 (7.1) 0 Computed tomography, No. (%) Ground-glass opacity 14 (41.2) 6 (42.8) 8 (40.0) Local patchy shadowing 25 (73.5) 10 (71.4) 15 (75.0) Bilateral patchy shadowing 16 (47.1) 6 (42.8) 10 (50.0) Right lung patchy shadowing 24 (70.6) 11 (78.6) 13 (65.0) Treatment, No. (%) Antiviral therapy 24 (70.6) 13 (92.9)* 11 (55.0)* Antibiotic therapy 34 (100.0) 14 (100.0) 20 (100.0) Immunoglobin 1 (2.9) 0 1 (5.0) Corticosteroid 2 (5.8) 1 (7.1) 1 (5.0) Chinese patent drug 16 (47.1) 9 (64.3) 7 (35.0) Oxygen support 4 (11.8) 1 (7.1) 3 (15.0) Prognosis, No. (%) Discharge 34 (100.0) 14 (100.0) 20 (100.0) Hospital stays, ds, median (IQR) 9.4 (7.0–12.0) 11.2 (6.8–16.3) 8.2 (7.0–8.8) Group NP, confirmed cases with SARS-CoV-2 nucleic acid positive. Group AP, cases with SARS-CoV-2 antibody positive. IQR, interquartile range; Ig, immunoglobulin; ALT, alanine aminotransferase; AST, aspartate aminotransferase; TB, total bilirubin; BUN, blood urea nitrogen; CRE, creatinine; RNA, ribonucleic Acid; DNA, deoxyribonucleic acid; +, positive.

*Refers to a statistically significant difference between group NP and group AP, P < 0.05.
aProcalcitonin was available from 1 and 13 patients in the two groups.
bIgA, IgM and IgG were available from 9 and 11 patients in the two groups.Table 2. Epidemiological and clinical characteristics of 34 patients.
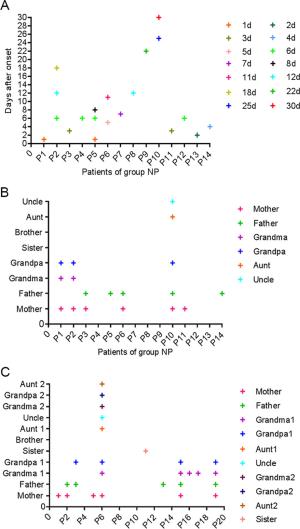
Figure 3 个
Table 2 个