-
-
-
Healthy controls (n = 200) Chronic HCV infection (n = 292) HCV-spontaneous clearance (n = 100) Age (years) 55 [13-93] 63 [20-88] 58 [20-76] Gender (%) Male 67 (33.5) 108 (36) 41(41) Female 133 (66.5) 192 (64) 59 (59) Biochemical variables (mean ± SD) Alanine aminotransferase (IU/L) 35.33 ± 21.52 78.43 ± 55.23 46.44 ± 56.25 Aspartate aminotransferase (IU/L) 29.35 ± 16.39 68.85 ± 46.25 34.7 ± 21.43 Bilirubin (μmol/L) NA 15.19 ± 6.08 15.16 ± 11.17 Creatinine (μmol/L) NA 108.54 ± 199.72 82.34 ± 34.55 Fasting serum glucose (g/L) 0.95 ± 0.19 1.06 ± 0.41 1.23 ± 0.54 Total cholesterol (g/L) 1.91 ± 0.38 1.53 ± 0.36 1.72 ± 0.38 Triglycerides (g/L) 1.31 ± 0.68 1.04 ± 0.37 1.37 ± 1.33 HDL-cholesterol (g/L) 0.54 ± 0.36 0.52 ± 0.17 0.48 ± 0.10 LDL-cholesterol (g/L) 1.11 ± 0.38 0.86 ± 0.6 0.94 ± 0.36 Median viral load (IU/mL) NA 2.8 E + 06 - [range] [0.9 E + 03 - 64.5 E + 06] Viral genotypes (%) Genotype 1 - 59.90 - Genotype 2 - 39.06 - Genotype 3 - 0.52 - Genotype 4 - 0.52 - Disease stages (n) mCHC - 92 - AdLD - 127 - HCC - 73 - SD standard deviation, Na non applicable, HDL high density lipoprotein, LDL low density lipoprotein, mCHC mild chronic hepatitis C, AdLD advanced liver disease, HCC hepatocellular carcinoma. Table 1. Baseline characteristics of healthy subjects, chronic HCV patients and HCV-spontaneous clearance group.
-
Mild chronic hepatitis (n = 92) Advanced liver disease (n = 200) P value Mean age ± SD (years) 57.13 ± 14.09 64.14 ± 9.47 < 0.0001 Gender (%) Male 26 (27.37) 41 (31.30) 0.558 Female 69 (72.63) 90 (68.70) Biochemical variables (mean ± SD) Alanine aminotransferase (IU/L) 53.63 ± 39.77 96.69 ± 58.73 < 0.0001 Aspartate aminotransferase (IU/L) 42.91 ± 24.91 87.94 ± 51.96 < 0.0001 Bilirubin (μmol/L) 13.13 ± 5.54 16.76 ± 6.01 < 0.0001 Creatinine (μmol/L) 87.91 ± 165.39 130.56 ± 249.41 0.148 Fasting serum glucose (g/L) 0.97 ± 0.19 1.14 ± 0.53 0.003 Total cholesterol (g/L) 1.60 ± 0.36 1.47 ± 0.31 0.004 Triglycerides (g/L) 1.03 ± 0.38 1.06 ± 0.40 0.570 HDL-cholesterol (g/L) 0.54 ± 0.19 0.51 ± 0.15 0.186 LDL-cholesterol (g/L) 0.91 ± 0.68 0.74 ± 0.31 0.012 Median viral load (IU/mL) 2.7 E + 06 2.9 E + 06 0.818 [range] [1.7 E + 03-31.8 E + 06] [0.9 E + 03-64.5 E + 06] Viral genotypes (%) Genotype 1 53.85 64.03 0.114 Genotype 2 46.15 34.21 - Genotype 3 - 0.88 - Genotype 4 - 0.88 - SD standard deviation, HDL high density lipoprotein, LDL low density lipoprotein. Table 2. Baseline characteristics of mild and advanced liver diseases groups.
-
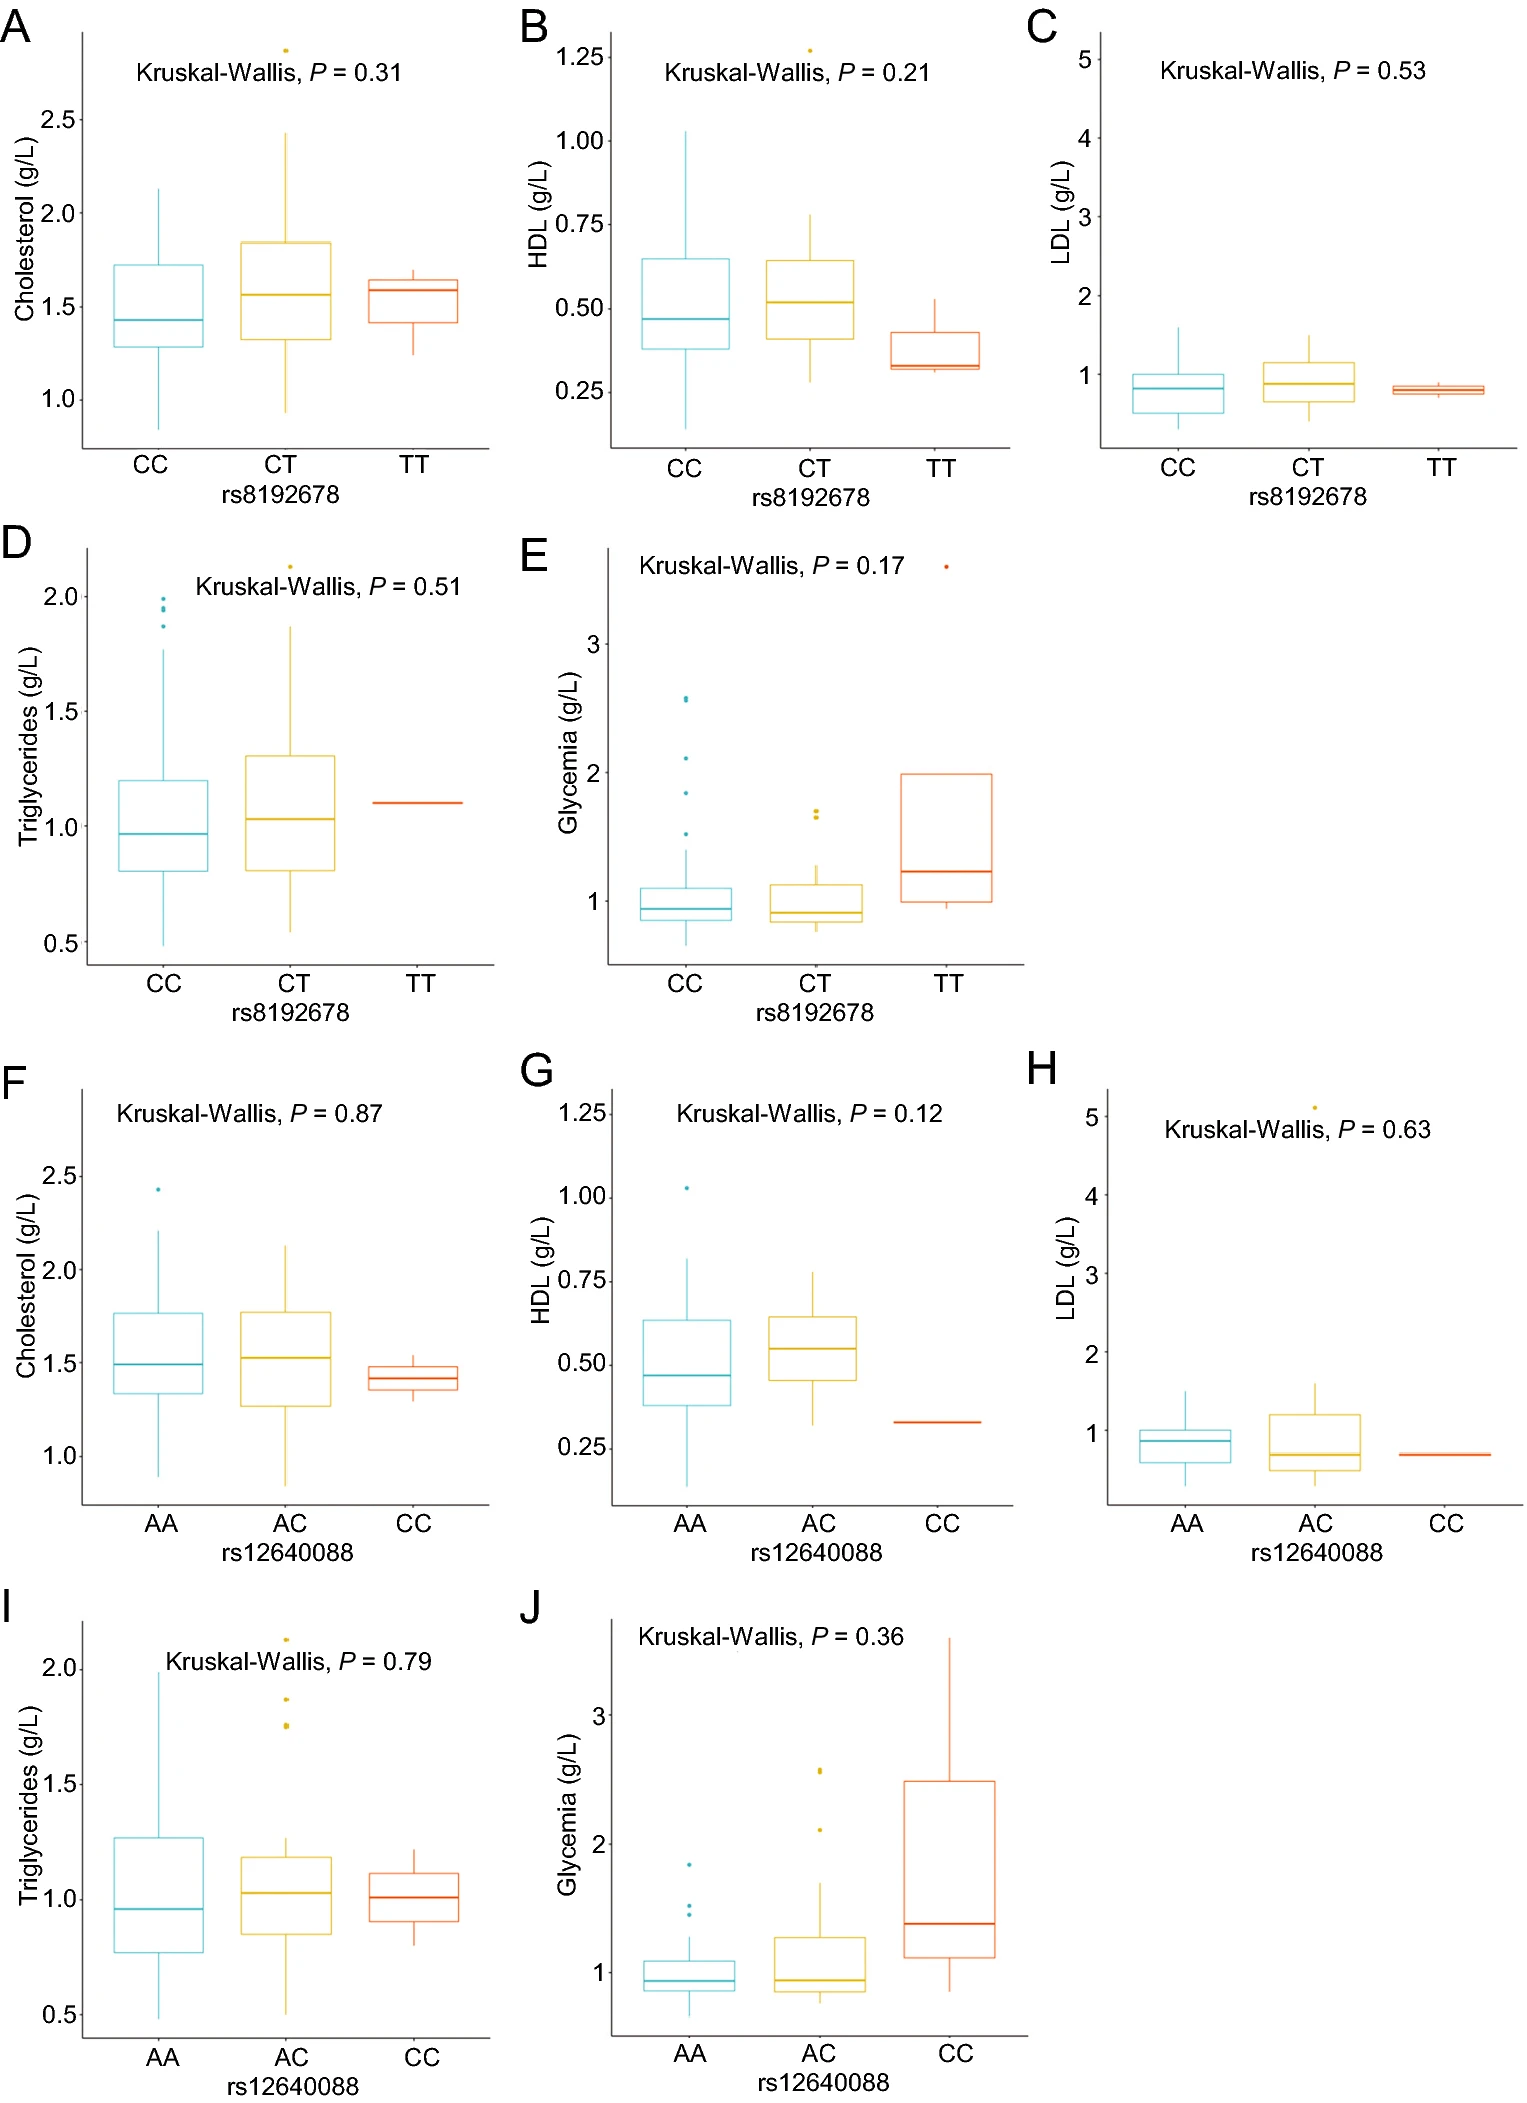
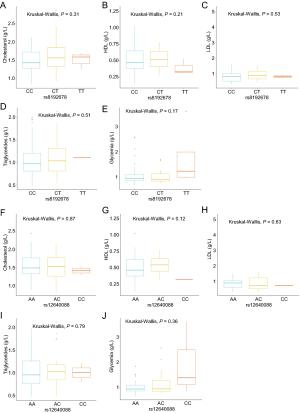
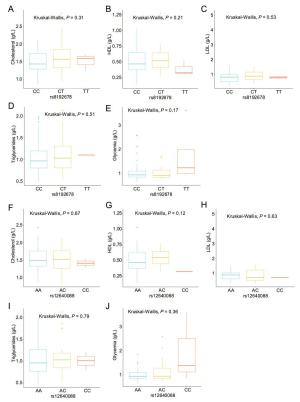
PPARGC1A Healthy controls n = 200 (%) Spontaneous clearance n = 100 (%) Persistent infection n = 292 (%) Subjects with persistence versus subjects with spontaneous clearance OR (95% Cl) P value rs8192678 G/G 142 (71) 48 (48) 166 (56.85) 1 G/A 46 (23) 44 (44) 105 (35.96) 0.69 [0.43-1.11] 0.126 A/A 12(6) 8 (8) 21 (7.19) 0.76 [0.32-1.82] 0.536 G allele 0.825 ± 0.021 0.700 ± 0.032 0.748 ± 0.018 1 A allele 0.175 ± 0.021 0.300 ± 0.032 0.252 ± 0.018 0.78 [0.55-1.12] 0.181 Dominant model 48/52 166/126 0.70 [0.44-1.10] 0.125 Recessive model 92/8 271/21 1.12 [0.48-2.62] 0.789 rs12640088 A/A 154 (77) 75 (75) 221 (75.68) 1 A/C 46 (23) 22 (22) 64 (21.92) 0.99 [0.57-1.71] 0.963 C/C 0 (0) 3 (3) 7 (2.40) 0.79 [0.20-3.14] 0.739 A allele 0.885 ± 0.015 0.860 ± 0.026 0.866 ± 0.014 1 C allele 0.115 ± 0.015 0.140 ± 0.026 0.134 ± 0.014 0.95 [0.59-1.51] 0.818 Dominant model 75/25 221/71 0.96 [0.57-1.63] 0.890 Recessive model 97/3 285/7 1.26 [0.32-4.97] 0.745 Table 3. Effect of PPARGC1A polymorphisms on the outcomes of HCV infection.
-
Mild group (n = 92) Advanced group (n = 200) OR 95% CI P value Age (years) 58.5 [51-67] 65 [58-73] 1.06 1.04-1.09 < 0.001 Male sex (%) 23 (25.0%) 81 (41.3%) 2.1 1.23-3.71 0.011 Total cholesterol (g/L) 1.64 [1.36-1.85] 1.42 [1.27-1.68] 0.23 0.07-0.75 0.015 Triglycerides (g/L) 0.96 [0.81-1.27] 0.98 [0.78-1.21] 1.12 0.41-3.06 0.874 HDL (g/L) 0.52 [0.42-0.66] 0.51 [0.38-0.60] 0.14 0.01-1.73 0.232 LDL (g/L) 0.89 [0.60-1.15] 0.80 [0.50-1.00] 0.42 0.10-1.68 0.200 Gamma-glutamyltransferase (IU/L) 27.0 [19.040.0] 63.5 [38.2-119] 1.02 1.01-1.03 < 0.001 ALT (IU/L) 40.5 [28.2-61.8] 82.0 [54.0-123] 1.02 1.01-1.04 < 0.001 AST (IU/L) 33.5 [27.0-44.2] 76.0 [51.5-116] 1.04 1.02-1.06 < 0.001 PPARGC1A rs8192678 AA genotype 4 (4.35%) 8 (6.30%) 0.71 0.20-2.49 0.739 PPARGC1A rs12640088 CC genotype 3 (2.36) 3 (2.36) 1.28 0.25-6.54 0.512 Factors associated with progression of liver disease in chronic hepatitis C patients.
HDL high density lipoprotein, LDL low density lipoprotein, ALT alanine aminotransferase, AST Aspartate aminotransferase, PPARGC1A Peroxisome proliferator-activated receptor gamma coactivator 1 alpha, OR Odds ratio, CI confidence interval.Table 4. Factors associated with disease progression of HCV infection.
Figure 2 个
Table 4 个