-

-
Gene ITGAV ITGB3 SNP rs3768777 rs3738919 rs5918 rs5921 rs13306487 Location in gene Intron Intron Exon Exon Exon Position 37665539 37730678 4014008 4022879 4023066 Location in mRNA - - 196 1377 1564 Nucleotide base A-G A-G C-T A-G A-G Amino acid mutation - - Pro-Leu Ile-Val Gln-Arg MAF in CHB 0.232 0.058 0.007 0.004 0.050 Table 1. Background information of selected SNPs in this study
-
SNP Primers rs3768777 rs3768777-p 5′-GTTGCTAATGTTCCGCGTTGCA-3′ rs3768777-q 5′-GTAGTAGAAGATGGTCCTATCCACG-3′ rs3768777-a 5′-GGGGGGGGGCTCATCACCCCACCCCCA-3′ rs3768777-b 5′-GGGGGGGGCGTGCTCCTAACGCTAACAT-3′ rs3738919 rs3738919-p 5′-ATTTCCAGGTGGAACTTCTTTTGGA-3′ rs3738919-q 5′-TCACAATTCAGATTTTTGCCACTGG-3′ rs3738919-a 5′-GGGGGGGGGCGACACAAAGGAAATTTAGA-3′ rs3738919-b 5′-GGGGGGGGGCGGTGTGACACTTTACAAAG-3′ rs13306487 rs13306487-p 5′-AAGGCTGAGGAACTCCAGATTG-3′ rs13306487-q 5′-TGTTTCCAGTGGTTGCAGGTAT-3′ rs13306487-a 5′-GGGGGGGGGCCGAATGCAGCCCCCA-3′ rs13306487-b 5′-GGGGGGGGGCACGGGCTGACCCTCCC-3′ rs5921 rs5921-p 5′-AAGGCTGAGGAACTCCAGATTG-3′ rs5921-q 5′-TGTTTCCAGTGGTTGCAGGTAT-3′ rs5921-a 5′-GGGGGGGGGCTCAAGGACAGCCTGATCA-3′ rs5921-b 5′-GGGGGGGGGCATCAAAGGTGACCTGGAC-3′ Table 2. PCR primers used for SNPs amplification
-
SNP Group Genotypes Allele frequency (%) aa ab bb χ2 P a b χ2 P rs5918 Controls 0 1 100 0.467 0.494 1(0.5) 201(99.5) 0.464 0.496 Patients 0 2 88 2(1.1) 178(98.9) rs3768777 Controls 6 35 60 0.354 0.838 47(23.3) 155(76.7) 0.000 0.988 Patients 4 34 52 42(23.3) 138(76.7) rs3738919 Controls 0 14 87 0.328 0.567 14(6.9) 188(93.1) 0.306 0.580 Patients 0 10 80 10(5.6) 170(94.4) rs13306487 Controls 0 6 95 0.721 0.396 6(3.0) 196(97.0) 0.073 0.402 Patients 0 3 87 3(1.7) 177(98.3) rs5921 Controls 0 0 101 - - - - - - Patients 0 0 90 Table 3. Comparison of genotypes and allele frequencies of candidate SNPs between patients with HFRS and controls
-
Clinical features and laboratory data Mild type (n=9) Medium type (n=49) Severe type (n=11) Gravis type (n=1) Age (years)a 25.6±6 34.2±12.9 36.6±18.3 17 Sex (man/women) 7/2 38/11 7/4 1/0 WBC count at admission (×109/L) < 10 4 14 2 ≥10 5 35 9 1 Platelet count at admission (×109/L) ≥50 4 12 1 < 50 5 37 10 1 Maximum serum creatinine at oliguric phase (μmol/L)a 221.6±83.1 434.6±243.0 698.6±308.6 760.4 Patient hospital duration (days)a 10.7±2.2 12.0±4.6 15.6±12.3 2.0 Note: aData are presented as means±SDs Table 4. Demographic, clinical, and hematochemical characteristics in patients with different clinical types of HFRS
-
SNP Clinical type Genotypes Allele frequency (%) aa ab bb a b rs3768777 Mild 1 1 7 3(8.6) 15(14.3) Medium 3 19 27 25(71.5) 73(69.5) Severe 0 6 5 6(17.1) 16(15.2) Gravis 0 1 0 1(2.8) 1(1.0) rs3738919 Mild 0 2 7 2(25.0) 16(12.1) Medium 0 4 45 4(50.0) 94(71.2) Severe 0 2 9 2(25.0) 20(15.2) Gravis 0 0 1 0(0.0) 2(1.5) Table 5. Genotypes and allelic frequencies of rs3768777 and rs3738919 in the integrin αvβ3 gene in patients with different clinical types of HFRS
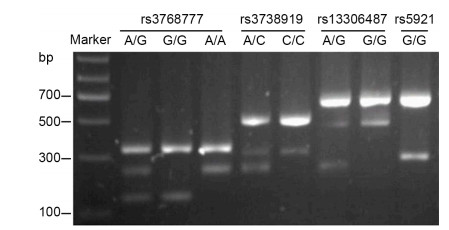
Figure 1 个
Table 5 个