-

-
-
-
Total
n = 49Local cases
n = 11Imported cases
n = 38Demographic Age range (year, mean ± SD) 0.6-17 (11.5 ± 5.12) 0.6-11 (5.8 ± 4.1) 2-17 (13.2 ± 4.1) Male patients (n. %) 28 (57.1%) 6 (54.5%) 22 (57.9%) Symptom (n. %) Cough 21 (42.9%) 9 (81.8%) 12 (31.6%) Fever 16 (32.7%) 8 (72.7%) 8 (21.1%) Sore throat 8 (16.3%) 3 (27.3%) 5 (13.2%) Stuffy nose 8 (16.3%) 4 (36.4%) 4 (10.5%) Rhinorrhea 7 (14.3%) 3 (27.3%) 4 (10.5%) Tachypnea/respiratory distress 0 0 0 Vomit 0 0 0 Diarrhea 0 0 0 Pneumoniaa 20 (40.8%) 6 (54.5%) 14 (36.8%) Loss of taste and smell 6 (12.2%) 0 6 (12.2%) aPneumonia was confirmed by chest X-ray or CT, including 5 asymptomatic cases. Table 1. Demographic and clinical features in local cases and imported cases.
-
Total
n = 49Symptomatic cases
n = 28Asymptomatic cases
n = 21Demographic Age range (year, mean ± SD) 0.7-17 (11.5 ± 5.12) 0.7-17 (11.3 ± 5.74) 2.3-17 (11.8 ± 4.3) Male patients (n. %) 28 (57.1%) 15 (53.6%) 13 (61.9%) Laboratory findings (median, IQR) White blood cell count (× 109/L) 6.1 (4.8-6.1) 6.2 (4.6-8.1) 6.0 (4.8-7.5) Neutrophil count (× 109/L) 2.7 (2.0-4.1) 3.0 (2.2-4.2) 2.8 (2.2-3.6) Lymphocyte count (× 109/L) 2.2 (1.7-2.8) 2.0 (1.7-2.8) 2.4 (2-3) Platelet count (× 109/L) 265 (215.5-331) 244 (205.8-319.8) 282 (226.5-343.5) C-reactive protein (mg/L) 0.5 (0.5-8) 4.1 (0.5-8) 0.5 (0.5-8.0) Procalcitonin (ng/dL) 0.03 (0.02-0.05) 0.04 (0.02-0.07) 0.02 (0.02-0.03) Alanine aminotransferase (U/L) 16.0 (12-20) 14.9 (10-21.5) 16.5 (13-19.5) Aspartate aminotransferase (U/L) 23.0 (18.8-29.8) 21.7 (18-33.7) 24.3 (19-29) Creatinine (µmol/L) 50.7 (39.4-64.2) 52.0 (34.5-68.8) 50.7 (41-59.6) Urea (mmol/L) 4.2 (3.5-4.7) 4.1 (3.5-5.3) 4.2 (3.4-4.5) Creatine kinase (U/L) 80 (65.5-101) 75.5 (54-94.3) 84 (69.5-105) Creatine kinase-MB (U/L) 15.0 (12.8-21.1) 15 (12.4-19.6) 15.3 (13.4-22.6) Lactate dehydrogenase (U/L) 212.5 (188.3-234) 211 (186-242) 214 (193-229.5) Cardiac troponin I 0.01 (0.01-0.03) 0.02 (0.01-0.04) 0.01 (0.01-0.02) SD standard deviation, IQR interquartile range. Table 2. Demographic and laboratory findings in symptomatic cases and asymptomatic cases.
-
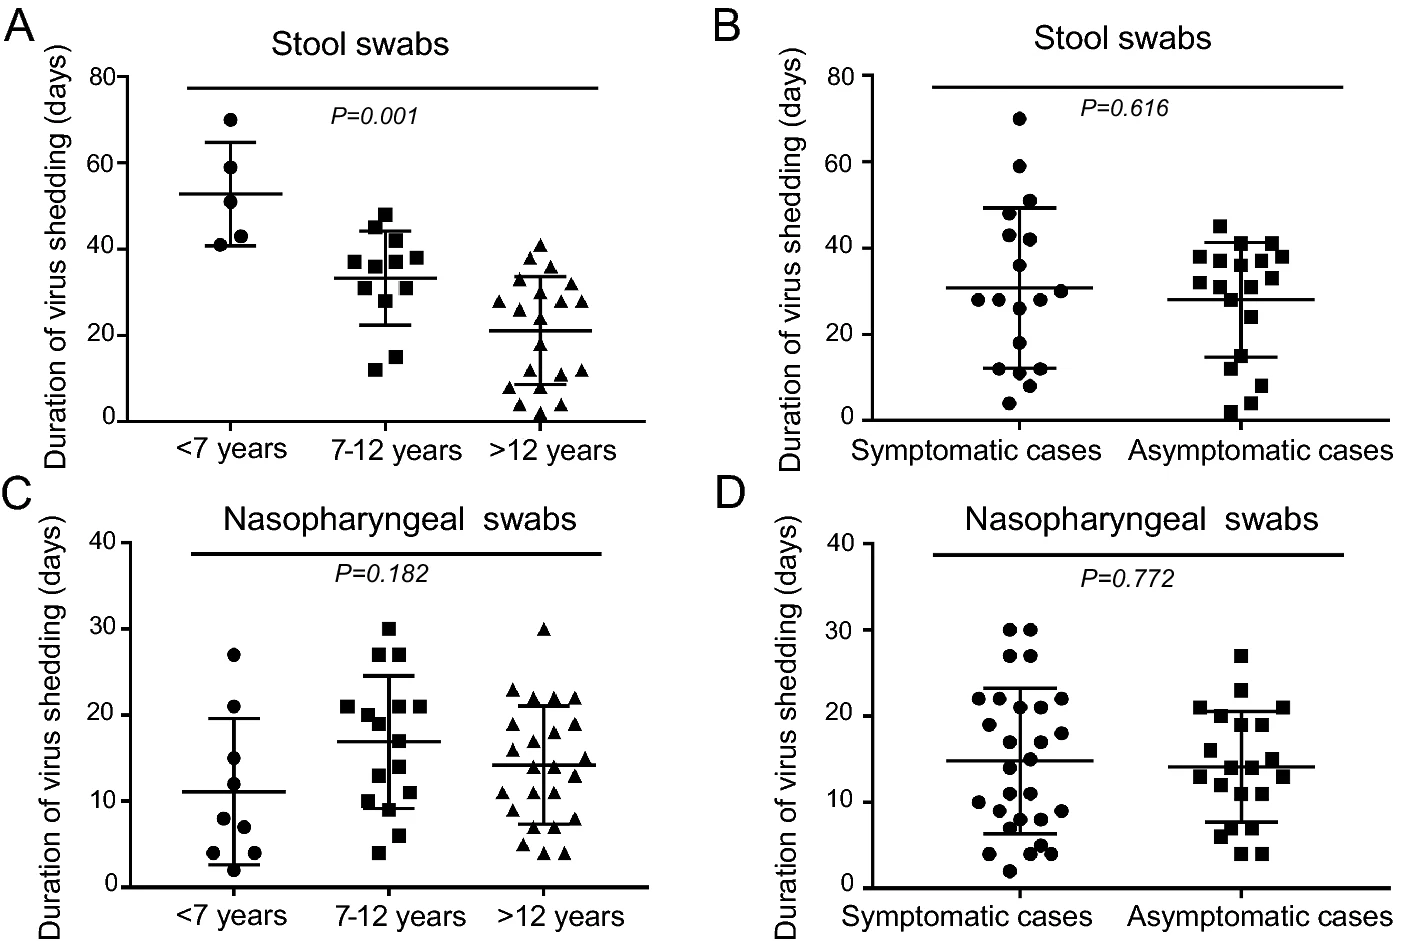
No of cases Mean ± SD Range P value Virus RNA shedding in gastrointestinal tract (days) in 37 casesa consecutively monitored < 7 years 5 52.8 ± 12.0 41–70 7–12 years 12 33.3 ± 11.0 12–48 0.001 > 12 years 20 21.2 ± 12.5 2–41 Symptomatic cases 18 30.8 ± 18.6 4–70 0.616 Asymptomatic cases 19 28.1 ± 13.3 2–45 Virus RNA shedding in upper respiratory tract (days) in 49 cases consecutively monitored < 7 years 9 11.1 ± 8.5 2–27 7–12 years 16 16.9 ± 7.7 4–30 0.182 > 12 years 24 14.2 ± 6.8 4–30 Symptomatic cases 28 14.8 ± 8.4 2–30 0.772 Asymptomatic cases 21 14.1 ± 6.4 4–27 aAmong the 45 cases tested positive for SARS-CoV-2 RNA, thirty-seven were followed up until the nucleic acids of SARS-CoV-2 were undetectable and 8 children could not return to hospital for follow-up because they lived outside Shanghai City. Table 3. The duration of virus RNA shedding by age and symptom.
Figure 3 个
Table 3 个