-
-
-
-
Family Patient Relation Sex Age (Years) HBsAg (IU/mL) HBeAg (S/CO) HBV DNA (IU/mL) Ⅰ Ia Mother F 30.7 128640 2299.3 1.42×10⁸ 37.0 256360 2928.0 5.50×10⁷ Ⅰb Daughter F 5.9 70720 2055.2 1.14×10⁸ Ⅱ Ⅱa Mother F 21.4 52890 2607.8 9.04×10⁶ 28.0 29124 2119.4 3.00×10⁶ Ⅱb Daughter F 6.1 57550 1719.4 8.99×10⁶ Ⅲ Ⅲa Mother F 25.5 3448 3270.6 5.91×10⁶ 32.3 8752 1885.7 5.29×10⁶ Ⅲb Daughter F 6.4 11130 1876.5 5.97×10⁶ Ⅳ Ⅳa Mother F 25.8 149280 2297.9 1.06×10⁷ 33.0 139260 2794.2 1.08×10⁷ Ⅳb Son M 6.7 133200 2178.9 2.32×10⁷ Ⅴ Ⅴa Mother F 25.6 36758 1820.9 2.39×10⁶ 32.7 94220 2612.9 3.67×10⁷ Ⅴb Son M 6.7 31676 1662.9 4.11×10⁷ Ⅵ Ⅵa Mother F 22.5 32580 1542.3 5.99×10⁶ 28.5 81490 1829.3 2.63×10⁷ Ⅵb Daughter F 5.6 60600 2279.6 1.27×10⁸ Ⅶ Ⅶa Mother F 27.4 37688 1133.0 5.68×10⁶ 34.3 60530 1510.8 1.27×10⁷ Ⅶb Daughter F 6.5 69900 1693.3 2.14×10⁷ Ⅷ Ⅷa Mother F 24.2 84270 1655.5 2.16×10⁷ 30.2 27038 1759.0 2.60×10⁷ Ⅷb Son M 5.5 70942 1489.8 2.13×10⁷ All patients were negative for IgM antibody against hepatitis B core antigen, and had normal levels of ALT. They were in the phase 1, the HBeAg-positive chronic infection phase, previously known as the immune tolerant phase of HBV infection. Table 1. Virological characteristics in group one consisting of younger mothers and their children.
-
Family No. Patient No. Relation Sex Age (Years) HBsAg (IU/mL) HBeAg (S/CO) anti-HBe (S/CO) HBV DNA (IU/mL) ALT (U/L) Phasea Ⅸ Ⅸa Index F 78 92 0.4 0.2 5.51×10⁶ 969.8 2 Ⅸb Daughter F 53 1803 - + 2.40×10² 12.6 3 Ⅸc Son M 45 97005 2214.9 - 1.59×10⁸ 34.5 1 X Xa Index F 71 254 - + 2.86×10⁶ 237.1 4 Xb Son M 40 168 - - 1.32×10² 16.9 3 Ⅺ Ⅺa Index F 63 244.11 1.58 1.72 Undetectable 78.2 2 Ⅺb Son M 41 983 6.9 1.75 1.05×10⁶ 44.8 2 Ⅺc Son M 38 827 - + 3.28×10² 17.9 3 Ⅻ Ⅻa Indexb F 46 - - + Undetectable 22.4 5 Ⅻb Daughter F 23 10182 - + 3.40×10² 24.6 3 Ⅻc Son M 21 4678 490.4 16.02 1.26×10⁶ 550.3 2 ⅩⅢ ⅩⅢa Index M 46 5725 - + 1.51×10² 40.3 3 ⅩⅢb Son M 22 5202 - + 1.43×10² 19.5 3 ⅩⅣ ⅩⅣa Index F 40 155 0.6 + 1.94×10³ 71.8 2 ⅩⅣb Husband M 40 0.8 - - 1.25×10² 14.7 3 All patients were positive for total antibody against hepatitis B core antigen.
aPhases 1–5 refer to HBeAg-positive chronic infection, HBeAg-positive chronic hepatitis, HBeAg-negative chronic infection, HBeAg-negative chronic hepatitis, and HBsAg-negative phase, respectively.
bThis patient had history of chronic HBV infection and did not receive antiviral therapy, but showed negative HBsAg and positive anti-HBs at the enrollment.Table 2. Virological characteristics in group two consisting of elderly parents and adult offspring.
-
Family Patient Relation Sex Age (Years) Compared to indexa Compared to GQ205441 nt (%) aa (%) nt (%) aa (%) Group one Ⅰ Ⅰa Index F 30.7 - - 3 (0.48) 0 (0.0) 37.0 0 (0.0) 0 (0.0) 3 (0.48) 0 (0.0) Ⅰb Daughter F 5.9 0 (0.0) 0 (0.0) 3 (0.48) 0 (0.0) Ⅱ Ⅱa Index F 21.4 - - 5 (0.8) 0 (0.0) 28.0 0 (0.0) 0 (0.0) 5 (0.8) 0 (0.0) Ⅱb Daughter F 6.1 0 (0.0) 0 (0.0) 5 (0.8) 0 (0.0) Ⅲ Ⅲa Index F 25.5 - - 4 (0.64) 0 (0.0) 32.3 0 (0.0) 0 (0.0) 4 (0.64) 0 (0.0) Ⅲb Daughter F 6.4 0 (0.0) 0 (0.0) 4 (0.64) 0 (0.0) Ⅳ Ⅳa Index F 25.8 - - 4 (0.64) 0 (0.0) 33.0 0 (0.0) 0 (0.0) 4 (0.64) 0 (0.0) Ⅳb Son M 6.7 0 (0.0) 0 (0.0) 4 (0.64) 0 (0.0) Ⅴ Ⅴa Index F 25.6 - - 5 (0.8) 0 (0.0) 32.7 0 (0.0) 0 (0.0) 5 (0.8) 0 (0.0) Ⅴb Son M 6.7 0 (0.0) 0 (0.0) 5 (0.8) 0 (0.0) Ⅵ Ⅵa Index F 22.5 - - 8 (1.28) 0 (0.0) 28.5 0 (0.0) 0 (0.0) 8 (1.28) 0 (0.0) Ⅵb Daughter F 5.6 0 (0.0) 0 (0.0) 8 (1.28) 0 (0.0) Ⅶ Ⅶa Index F 27.4 - - 4 (0.64) 0 (0.0) 34.3 0 (0.0) 0 (0.0) 4 (0.64) 0 (0.0) Ⅶb Daughter F 6.5 0 (0.0) 0 (0.0) 4 (0.64) 0 (0.0) Ⅷ Ⅷa Index F 24.2 - - 9 (1.44) 0 (0.0) 30.2 1 (0.001) 0 (0.0) 8 (1.28) 0 (0.0) Ⅷb Son M 5.5 0 (0.0) 0 (0.0) 9 (1.44) 0 (0.0) Group two Ⅸ Ⅸa Index F 78 - - 23 (3.69) 15 (7.2) Ⅸb Daughter F 53 35 (5.61) 28 (13.46) 24 (3.85) 17 (8.2) Ⅸc Son M 45 22 (3.53) 14 (6.73) 6 (0.96) 1 (0.5) Ⅹ Ⅹa Index F 71 - - 9 (1.44) 5 (2.4) Ⅹb Son M 40 14 (2.24) 10 (4.80) 13 (2.08) 7 (3.4) Ⅺ Ⅺa Index F 63 Undetectable Ⅺb Son M 41 - - 6 (0.96) 4 (1.9) Ⅺc Son M 38 19 (3.04) 11 (5.29) 23 (3.69) 15 (7.2) Ⅻ Ⅻa Index F 46 Undetectable Ⅻb Daughter F 23 - - 14 (2.24) 10 (4.8) Ⅻc Son M 21 20 (3.21) 15 (7.21) 13 (2.08) 8 (3.8) ⅩⅢ ⅩⅢa Index M 46 - - 24 (3.85) 14 (6.7) ⅩⅢb Son M 22 27 (4.33) 19 (9.13) 7 (1.12) 7 (3.4) ⅩⅣ ⅩⅣa Index F 40 - - 15 (2.4) 10 (4.8) ⅩⅣb Husband M 40 16 (2.56) 12 (5.76) 13 (2.08) 7 (3.4) aPre-C/C sequences were compared to the sequences recovered from the index patients during the second trimester in families Ⅰ–Ⅷ, and to the sequences recovered from the index patients or other infected family members in families Ⅸ–ⅩⅣ. Table 3. Nucleotide and amino acid variations in pre-C/C gene among family members or compared to GQ205441.
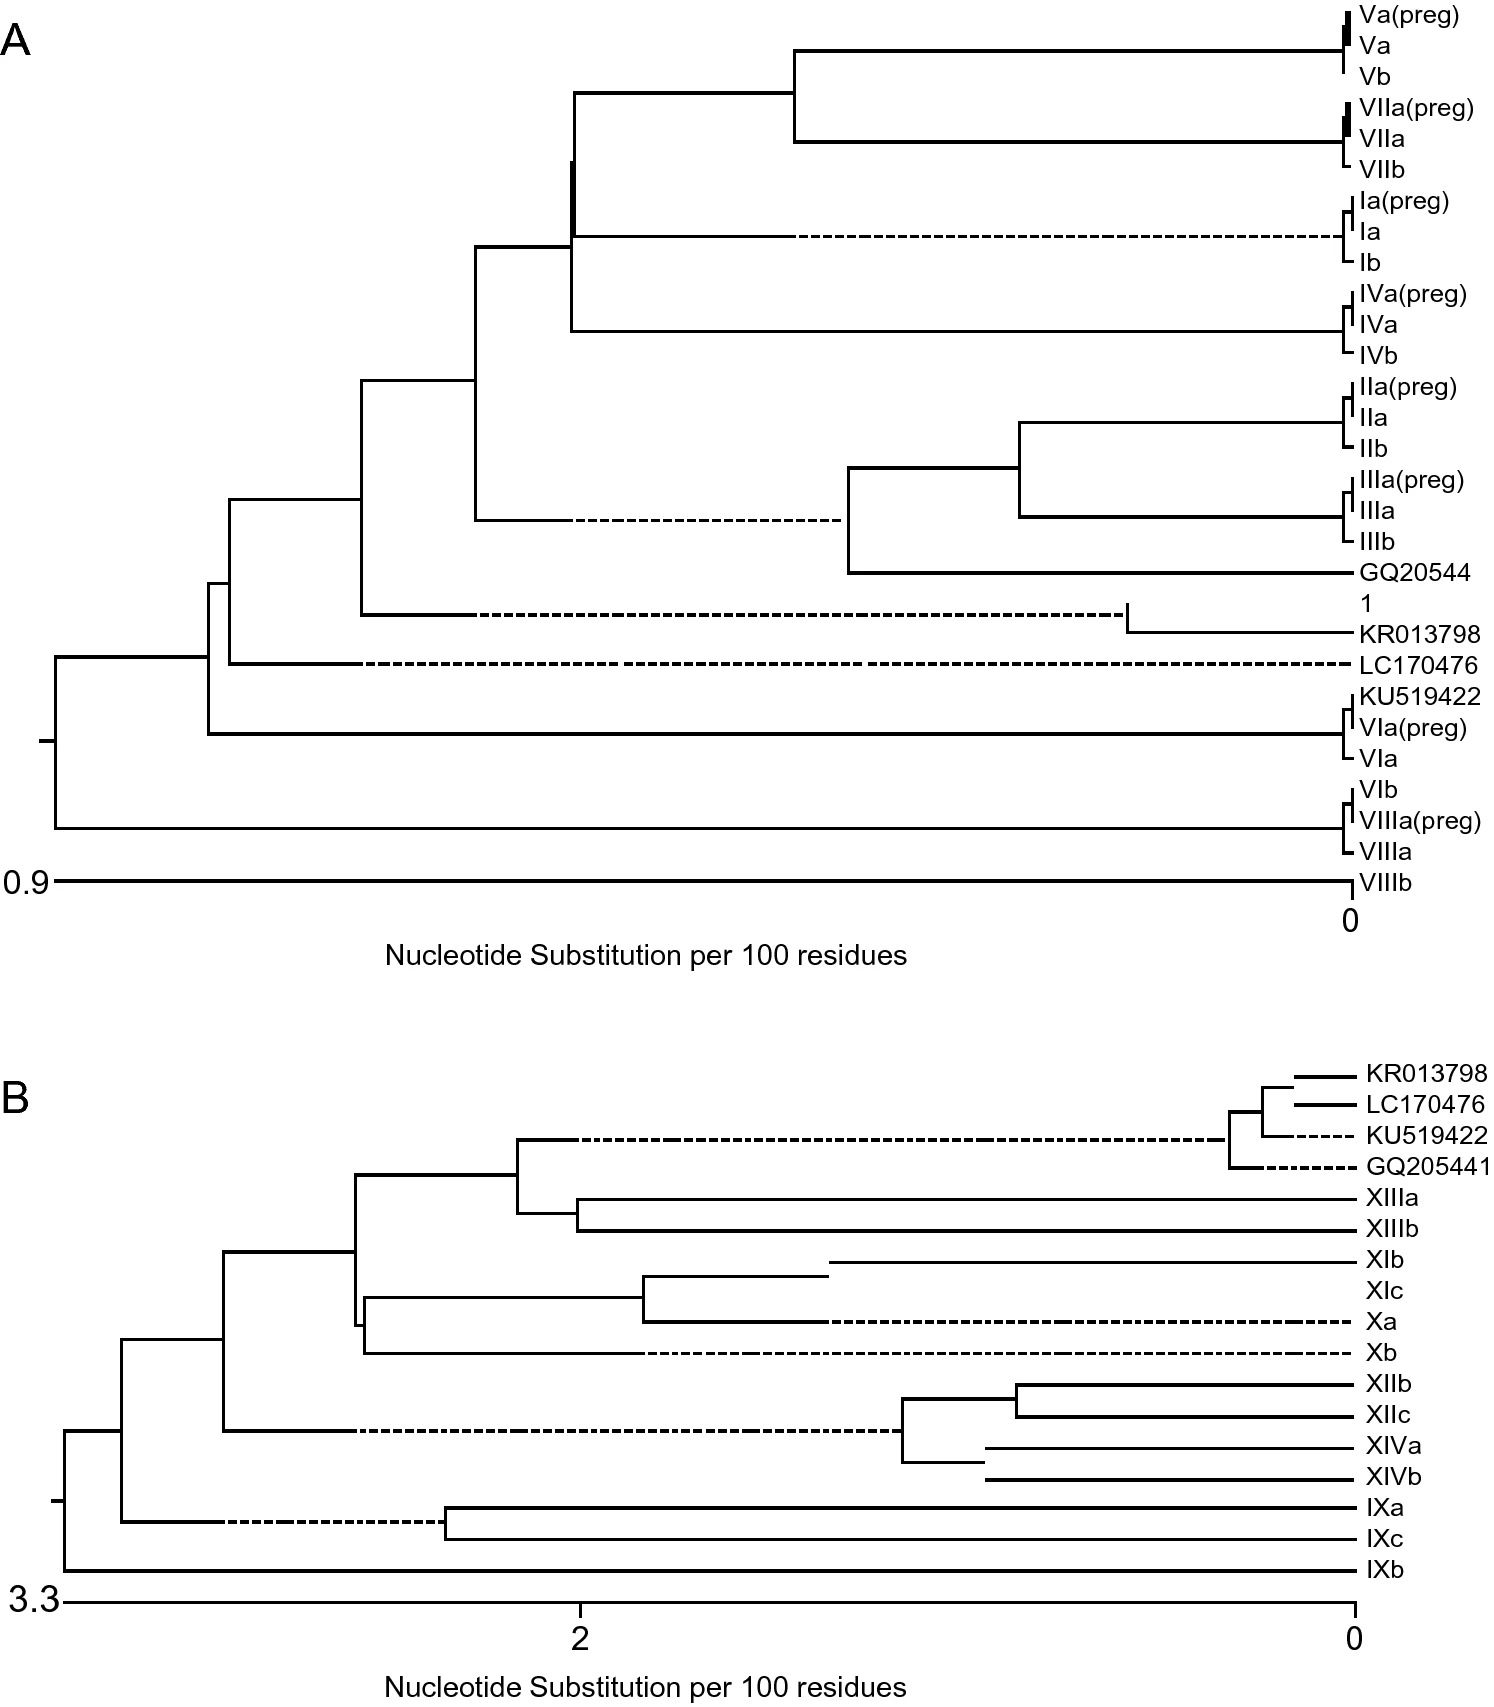
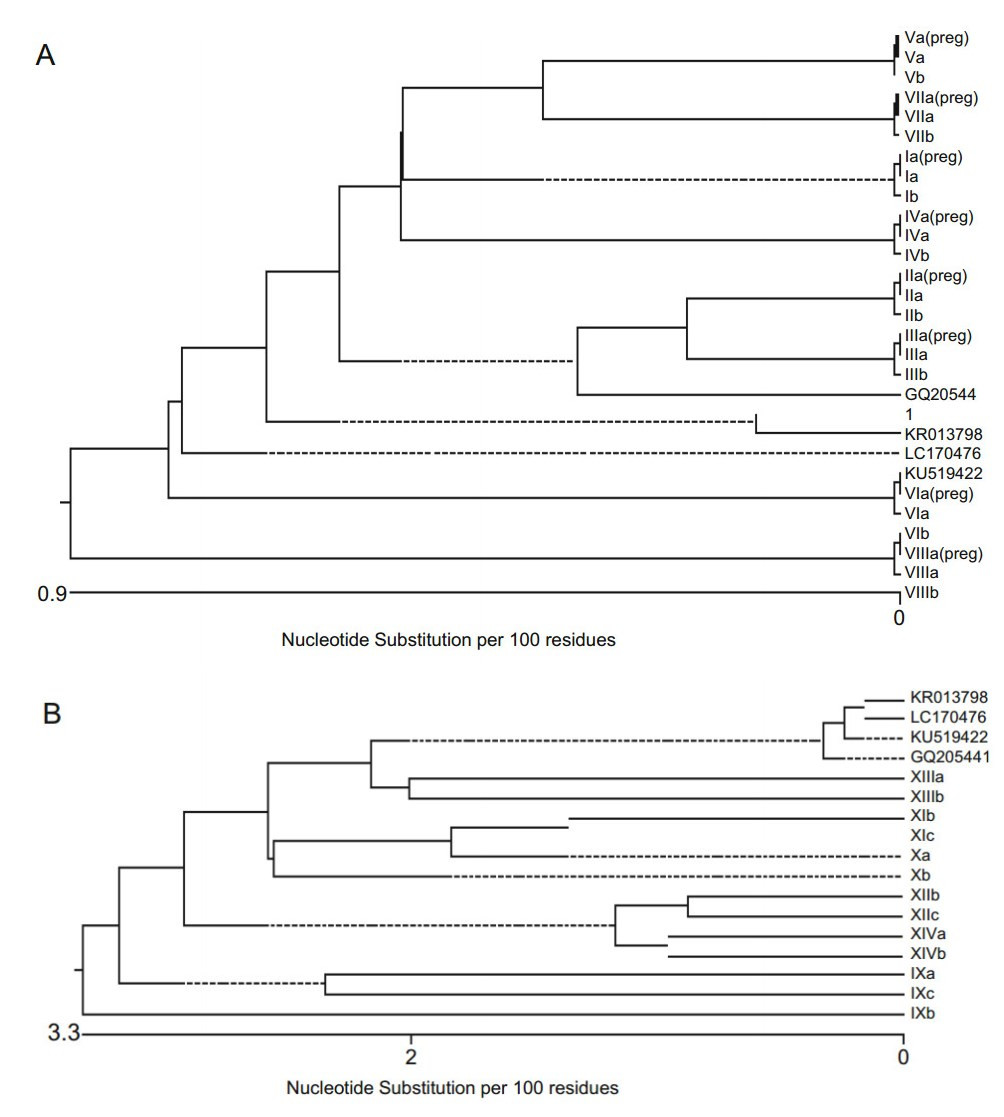
Figure 3 个
Table 3 个