-

-
-
-
-
-
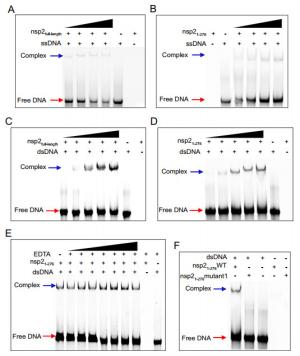
-
Parameters Value Data collection Wavelength (Å) 0.9793 Space group P21 Cell dimensions a, b, c (Å) 57.93, 159.6, 63.55 α, β, γ (°) 90, 91.2, 90 Resolution (Å)a 50.0–1.96 (2.06–1.96) I/σ 17.9 (2.7) Rmerge 0.062 (0.673) Completeness (%) 99.8 (99.7) Total No. of reflections 555, 159 Unique reflections 82, 763 Redundancy 6.7 (5.8) Refinement Resolution (Å) 50.0–1.96 No. of reflections 75, 133 Rwork/Rfree (%) 19.97/22.56 No. of atoms Protein 8406 Ligand/ion 18 Water 925 B-factors (Å2) Protein 34.26 Ligand/ion 39.12 Water 42.08 r.m.s. deviationsb Bond lengths (Å) 0.003 Bond angles (º) 1.29 Ramachandran Plot (%)c 96.8/3.2/0.0 aStatistics for highest resolution shell.
bRoot mean square deviations
cResidues in favored, allowed, and outlier regions of the Ramachandran plot.Table 1. Data collection and refinement statistics of SARS-CoV-2 nsp21-276 (PDB: 7EXM)
Figure 6 个
Table 1 个