-

-

-

-

-
Variables Seropositive, n (%) P-valuec 2017a 2019b Gender Male 63/63 (100) 28/32 (87.5) ns Female 125/128 (97.7) 54/67 (80.6) < 0.0001 Age (y) 0–10 3/3 (100) 1/1 (100) ns 11–20 9/9 (100) 4/4 (100) ns 21–30 16/16 (100) 3/4 (75.0) ns 31–40 37/37 (100) 23/24 (95.8) ns 41–50 52/53 (98.1) 24/35 (68.6) 0.0001 51–60 40/42 (95.2) 21/24 (87.5) ns > 60 31/31 (100) 6/7 (85.7) ns Total 188/191 (98.4) 82/99 (82.8) 0.0004 a Four-year serum samples collected in 2017.
b Six-year serum samples collected in 2019.
c The statistical analysis was performed by Chi-square test.
IgG, immunoglobulin G; DENV, dengue virus; ns, no significance.Table 1. Demographic characteristics of participants and positive rates of DENV-specific IgG antibodies in patients at four-year and six-year convalescent phases for baseline serosurvey.
-
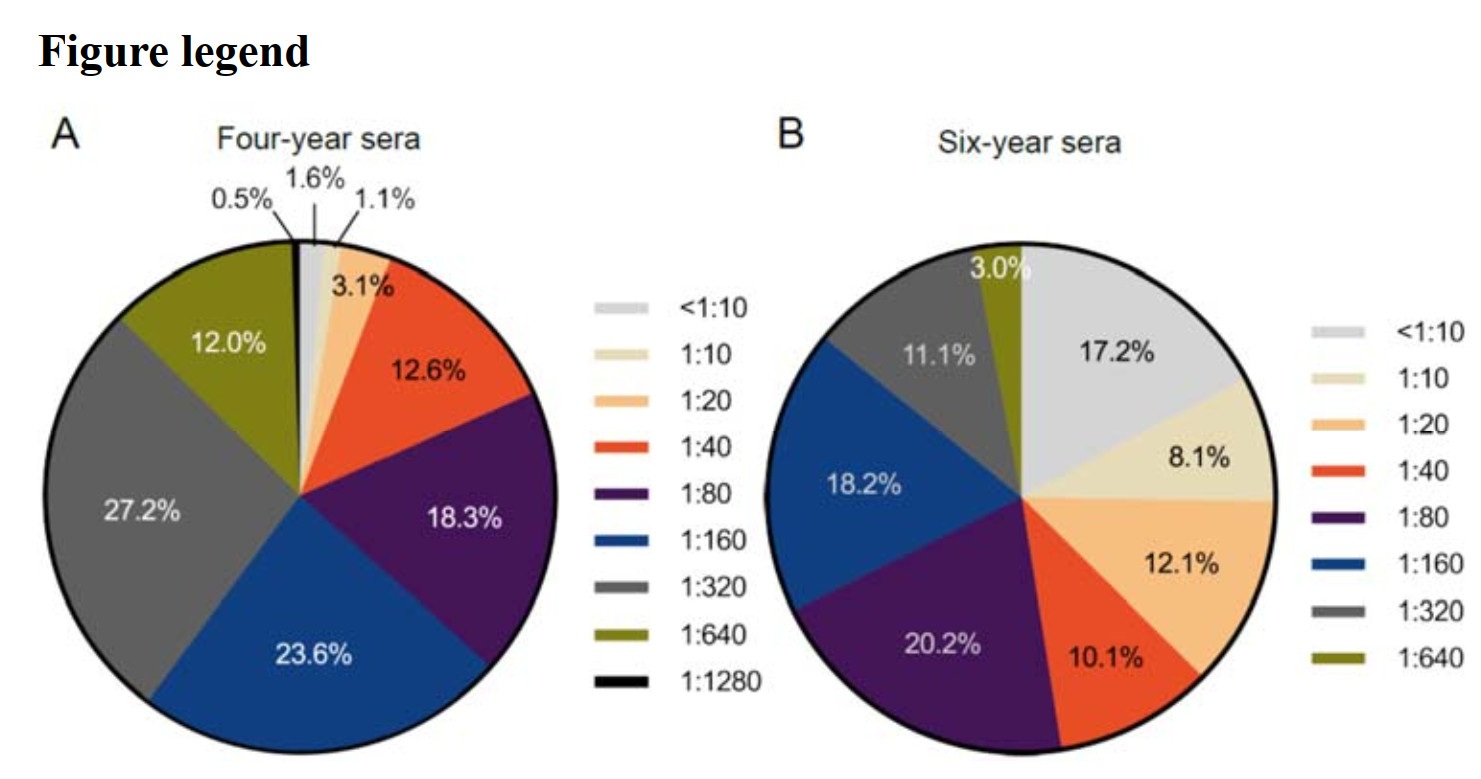
Variables NAb against DENV-3a P-valued 2017b (95% C.I.) 2019c (95% C.I.) Gender Male 160.00 (125.12–204.61) 59.07 (36.13–96.58) 0.0001 Female 153.06 (129.18–181.34) 41.69 (29.33–59.24) < 0.0001 Age (y) 0–10 126.99 (47.74–337.79) 80.00 (80.00–80.00) ns 11–20 201.59 (125.07–324.92) 134.54 (100.25–180.55) ns 21–30 146.72 (107.09–201.02) 40.00 (13.49–118.59) ns 31–40 157.03 (110.21–223.74) 62.33 (38.13–101.88) 0.0074 41–50 164.32 (122.00–221.32) 24.16 (14.77–39.50) < 0.0001 51–60 134.54 (102.64–176.36) 63.50 (35.22–114.14) 0.0472 > 60 163.62 (119.66–223.72) 72.46 (24.65–212.96) ns Total 155.35 (135.20–178.51) 46.66 (35.09–62.04) < 0.0001 a NAb titers were quantified by PRNT50 and the data were shown as GMT (95% C.I.).
b Four-year serum samples collected in 2017.
c Six-year serum samples collected in 2019.
d The statistical analysis was performed by Wilcoxon rank-sum test.
PRNT50, the reciprocal highest serum dilution that corresponded to a 50% reduction of the average number of plaques on the virus infection wells; GMT, geometric mean titer; NAb, neutralizing antibody; DENV, dengue virus; C.I., confidence interval; ns, no significance.Table 2. The GMT of NAb against DENV-3 in different gender and age populations at two convalescent phases for baseline serosurvey.
-
Variables Seropositive, n (%) P-valuec 2017a 2019b Gender Male 22/22 (100) 19/22 (86.4) ns Female 51/51 (100) 37/51 (72.5) < 0.0001 Age (y) 0–10 1/1 (100) 1/1 (100) ns 11–20 1/1 (100) 1/1 (100) ns 21–30 3/3 (100) 2/3 (66.7) ns 31–40 18/18 (100) 17/18 (94.4) ns 41–50 28/28 (100) 17/28 (60.7) 0.0002 51–60 18/18 (100) 15/18 (83.3) ns > 60 4/4 (100) 3/4 (75.0) ns Total 73/73 (100) 56/73 (76.7) < 0.0001 a Four-year serum samples collected in 2017.
b Six-year serum samples collected in 2019.
c The statistical analysis was performed by Chi-square test.
IgG, immunoglobulin G; DENV, dengue virus; ns, no significance.Table 3. Demographic characteristics of participants and positive rates of DENV-specific IgG antibodies in patients at four-year and six-year convalescent phases for follow-up serosurvey.
-
Variables DENV-1 P-valuec DENV-2 P-valuec DENV-3 P-valuec DENV-4 P-valuec 2017a
(95% C.I.)2019b
(95% C.I.)2017a
(95% C.I.)2019b
(95% C.I.)2017a
(95% C.I.)2019b
(95% C.I.)2017a
(95% C.I.)2019b
(95% C.I.)Gender Male 15.06
((10.40–20.70)11.71
(9.29–16.14)ns 22.69
(13.61–37.80)20.64
(12.40–34.35)ns 136.68
(92.55–201.85)82.56
(44.67–152.60)ns 56.57
(40.00–80.00)10.99
(7.81–15.47)< 0.0001 Female 13.12
(10.25–16.22)9.87
(9.29–16.14)0.0489 16.99
(13.63–21.18)12.60
(9.35–16.99)ns 183.29
(140.80–238.61)46.45
(30.42–70.94)< 0.0001 41.10
(32.30–52.31)7.22
(6.20–8.40)< 0.0001 Age (y) 0–10 10.00
(10.00–10.00)5.00
(5.00–5.00)ns 10.00
(10.00–10.00)5.00
(5.00–5.00)ns 160.00
(160.00–160.00)80.00
(80.00–80.00)ns 160.00
(160.00–160.0)10.00
(10.00–10.00)ns 11–20 40.00
(40.00–40.00)40.00
(40.00–40.00)ns 20.00
(20.00–20.00)80.00
(80.00–80.00)ns 640.00
(640.00–640.00)160.00
(160.00–160.00)ns 40.00
(40.00–40.00)20.00
(20.00–20.00)ns 21–30 25.20
(9.47–67.02)10.00
(5.27–18.97)ns 20.00
(10.54–37.95)6.30
(4.35–9.12)ns 126.99
(87.74–183.81)80.00
(22.22–287.98)ns 25.20
(12.03–52.79)10.00
(5.27–18.97)ns 31–40 12.60
(9.32–17.03)9.62
(7.05–13.13)ns 17.14
(11.75–25.03)17.14
(10.83–27.15)ns 148.14
(98.13–223.64)96.99
(57.61–163.26)ns 52.40
(34.30–74.05)8.57
(6.16–11.92)0.0002 41–50 11.90
(9.84–14.37)8.41
(6.80–10.40)0.0311 16.82
(12.05–23.48)9.28
(6.81–12.65)0.0013 172.33
(112.68–263.57)27.59
(15.70–48.48)< 0.0001 42.03
(29.44–60.00)7.07
(5.72–8.74)< 0.0001 51–60 15.27
(9.35–24.95)13.61
(8.52–21.73)ns 20.79
(12.82–33.69)31.75
(13.75–58.07)ns 186.64
(129.85–268.29)80.00
(38.48–166.30)0.0443 46.66
(32.46–67.07)8.57
(5.96–12.32)< 0.0001 > 60 16.81
(9.57–29.53)16.82
(6.96–40.64)ns 33.64
(9.13–123.97)8.41
(4.79–14.77)ns 134.54
(64.18–282.06)56.57
(9.08–352.30)ns 47.57
(22.69–99.72)10.00
(6.19–16.17)ns Total 13.80
(11.60–16.41)10.30
(8.66–12.46)0.0136 18.54
(14.93–23.01)14.60
(11.27–18.97)ns 167.70
(134.55–209.22)53.18
(37.11–76.20)< 0.0001 45.26
(37.01–55.33)8.17
(7.00–9.53)< 0.0001 NAb titers were quantified by PRNT50 and the data were shown as GMT (95% C.I.).
a Four-year serum samples collected in 2017.
b Six-year serum samples collected in 2019.
c The statistical analysis was performed by Wilcoxon rank sum test.
GMT, geometric mean titer; NAb, neutralizing antibody; DENV, dengue virus; C.I., confidence interval; ns, no significance; PRNT50, the reciprocal highest serum dilution that corresponded to a 50% reduction of the average number of plaques on the virus infection wells.Table 4. The GMT distribution of NAb against DENV-3 and cross-reactive antibody against DENV-1, DENV-2 and DENV-4 in different populations in consecutive samples for follow-up serosurvey (n = 73).
-
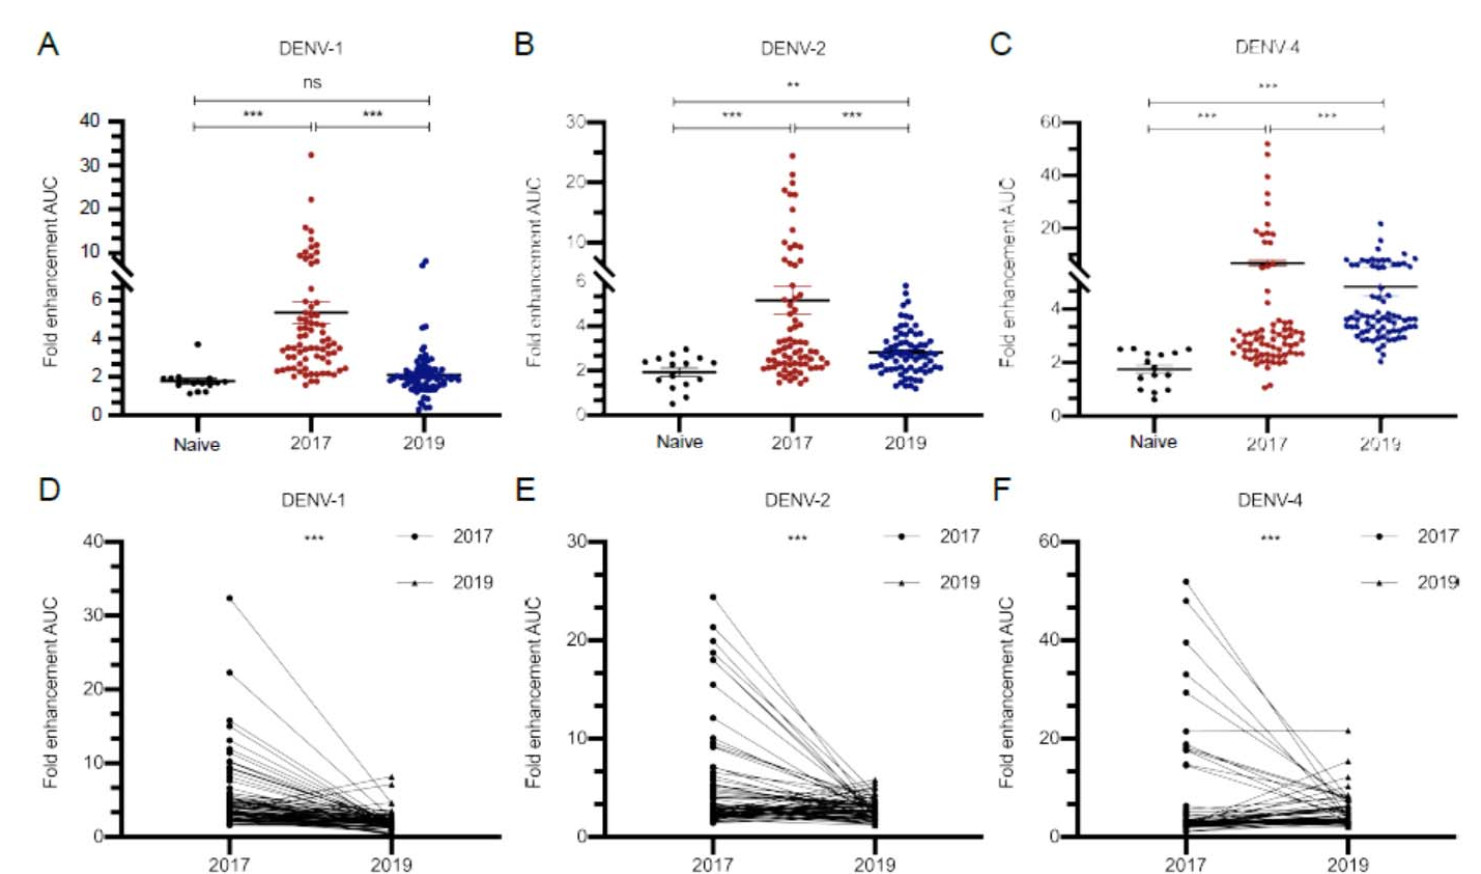
Variables DENV-1 OR (95% C.I.) P-valuec DENV-2 OR (95% C.I.) P-valuec DENV-4 OR (95% C.I.) P-valuec 2017a 2019b 2017a 2019b 2017a 2019b Gender Male 4 1 4.67 (0.48–45.62) ns 10 4 0.27 (0.07–1.05) ns 10 19 7.60 (1.73–33.35) 0.007 Female 26 5 0.11 (0.04–0.31) < 0.001 29 18 0.41 (0.19–0.92) 0.030 14 29 3.48 (1.52–7.97) 0.003 Age (y) 0–10 0 1 9.00 (0.10–831.78) ns 1 1 1.00 (0.01–92.42) ns 0 1 9.00 (0.10–831.78) ns 11–20 0 0 1.00 (0.01–92.42) ns 1 0 0.11 (0.00–10.27) ns 1 1 1.00 (0.01–92.42) ns 21–30 1 1 1.00 (0.03–29.81) ns 1 2 4.00 (0.13–119.23) ns 1 3 11.67 (0.32–422.14) ns 31–40 9 1 0.06 (0.01–0.54) 0.012 7 2 0.20 (0.03–1.13) ns 3 13 13.00 (2.59–65.20) 0.002 41–50 12 2 0.10 (0.02–0.52) 0.006 18 10 0.31 (0.10–0.92) 0.035 11 16 2.06 (0.71–5.98) ns 51–60 5 1 0.15 (0.02–1.47) ns 11 5 0.25 (0.06–0.99) 0.049 7 13 4.09 (1.01–16.58) 0.049 > 60 2 0 0.10 (0.00–3.35) ns 0 2 9.00 (0.30–271.70) ns 1 2 3.00 (0.15–59.89) ns AUC ≤ 5 25 4 0.07 (0.02–0.22) < 0.001 21 19 0.62 (0.29–1.31) ns 10 29 5.68 (2.39–13.50) < 0.001 6–15 15 2 0.16 (0.00–10.14) ns 12 3 0.09 (0.00–2.83) ns 4 18 4.11 (0.07–236.69) ns ≥ 16 3 0 0.14 (0.00–19.45) ns 6 0 0.08 (0.00–9.95) ns 10 1 0.14 (0.00–10.29) ns a The number of ADE-positive sera in four-year samples collected in 2017.
b The number of ADE-positive sera in six-year samples collected in 2019.
c The statistical analysis was performed by logistic regression.
DENV, dengue virus; AUC, area under curve; OR, odd ratio; C.I., confidence interval; ns: no significance.Table 5. Risk factor analysis of enhancement of DENV-1, DENV-2 and DENV-4 infections triggered by consecutive sera in different populations and AUC groups (n = 73).
Figure 4 个
Table 5 个