-
-
-
-

Table 1. Global results on the whole group and sub-groups.
-

Table 2. Compared characteristics of the whole group of patients and HCV RNA ∓ sub-groups.
-

Table 3. Percentages of drugs used in mono, multi therapy and all together.
-

Table 4. Comparison of the medians of VL at first sampling (1) and second sampling (2) in true positive treated patients with (+) or without (-) cycloferon in monotherapy versus dual therapy.
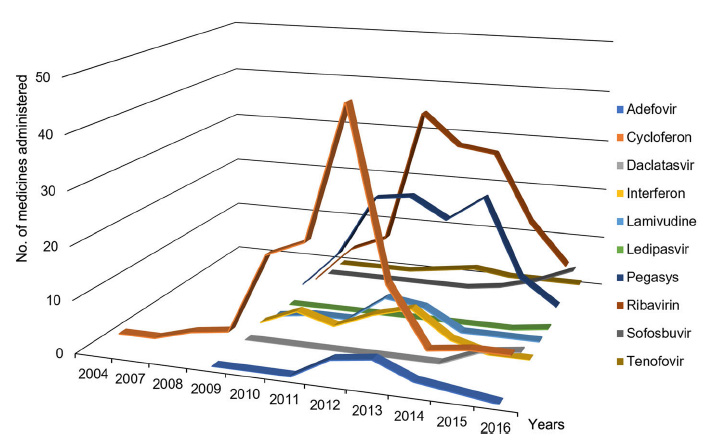
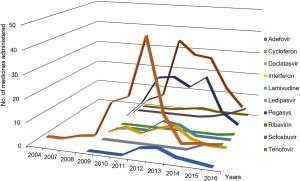
Figure 3 个
Table 4 个