-

-
-
-

-
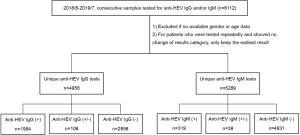
Anti-HEV IgG (n = 4956) Anti-HEV IgM (n = 5289) Age, median (range) 45 (0–99) 45 (0–99) Male, n (%) 2666 (53.8) 2788 (52.7) COI, median (range) 0.28 (0–24.92) 0.1 0.01–68.49) Table 1. Characteristics of study population tested for anti-HEV IgG or anti-HEV IgM.
-
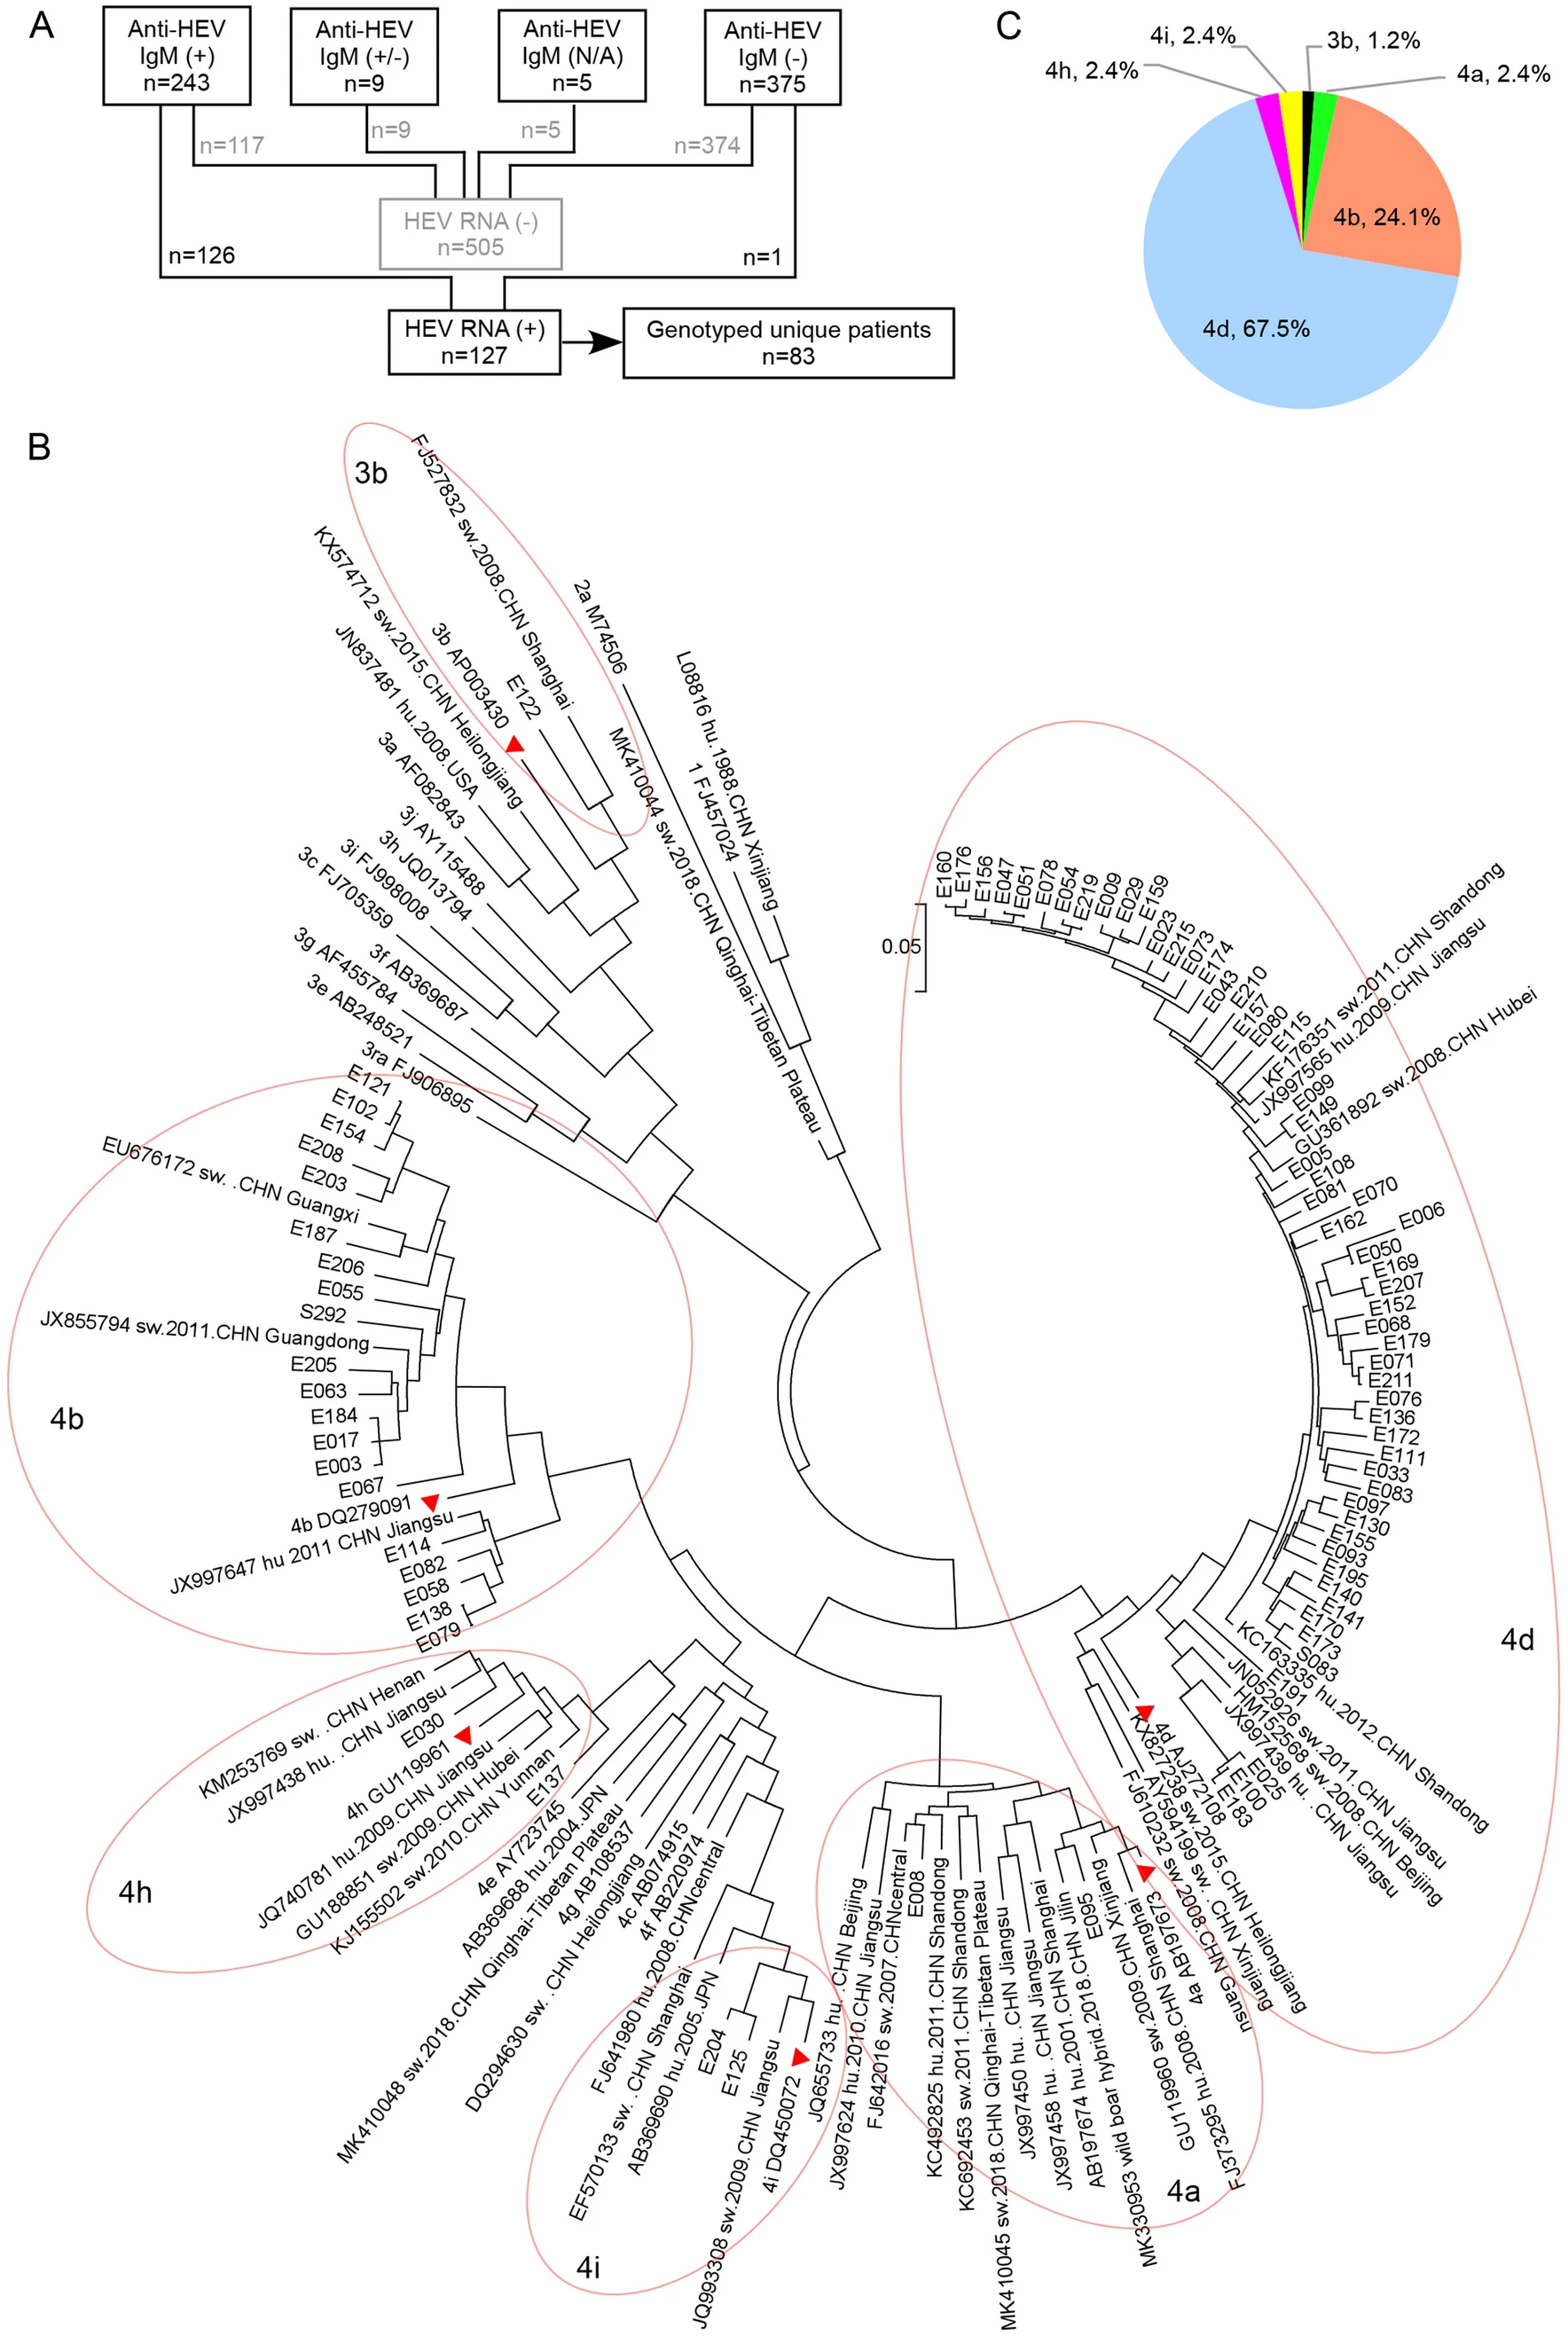
Anti-HEV IgM category (n) HEV RNA detected, n (%) ALT, 9 ULN1 Positive (243) 126 (51.9) 11.2±1.1 Negative (375) 1 (0.3) 8.4±0.5 Gray zone (9) 0 (0.0) 1.0±0.5 Not available (5) 0 (0.0) 5.3±2.2 1 Results are presented as mean ± SEM. Table 2. Characteristics of samples tested for HEV RNA by real time RT-PCR.
-
HEV RNA (+) (n = 126) HEV RNA (-) (n = 117) P value Anti-HEV IgG COI) 10.3±0.4 11.7±0.6 0.0674 Anti-HEV IgM (COI) 31.9±1.5 11.1±1.3 < 0.0001 ALT, × ULN 18.2±1.8 2.1±0.4 < 0.0001 AST, × ULN 18.4±2.7 2.4±0.3 < 0.0001 ALP, × ULN 1.5±0.1 1.1±0.1 0.0133 GGT, × ULN 3.5±0.2 2.2±0.5 0.0052 TBIL, × ULN 5.6±0.5 3.8±0.7 0.0243 1Results are presented as mean ± SEM; 2ULV: Upper limit of normal value. Table 3. Comparison of anti-HEV IgM (+) patients with or without HEV RNA detected 1.
-
Parameter Value Male, n (%) 69 (62.2) Age (years), median (range) 58 (25–86) Baseline laboratory tests1, median (range) ALT, × ULN 13.6 (0.6–96.8) AST, × ULN 8.3 (0.6–185.7) ALP, × ULN 1.4 (0.5–4.2) GGT, × ULN 3 (0.5–12.5) TBIL, × ULN 4.2 (0.3–26.8) Symptoms2, n (%) Abdominal pain 21 (20.4) Anorexia 70 (68.0) Fever 29 (28.2) Jaundice 78 (75.7) Malaise 49 (47.6) Nausea 44 (42.7) Vomiting 29 (28.2) Concomitant liver disease2, n (%) Alcoholic fatty liver disease 5 (4.9) Non-alcoholic fatty liver disease 17 (16.5) HBV carriage 13 (12.6) 1106 patients had available ALT, AST, ALP and GGT test results and 105 patients had available TBIL result at presentation to our hospital
2Information of symptoms and concomitant liver disease was available for 103 inpatients.Table 4. Characteristics of laboratory-confirmed cases of HEV infection.
-
Variables Length of hospital stay Univariate Multivariate β Coefficient P value β Coefficient P value Age 4.40 0.0384 Anti-HEV IgG 4.30 0.0408 Anti-HEV IgM 0.22 0.6389 7.83 0.0062 HBsAg (±) 1.41 0.2383 ALT/ULN 0.01 0.9391 AST/ULN 0.00 0.9628 ALP/ULN 5.94 0.0166 GGT/ULN 2.16 0.1447 TBIL/ULN 74.80 < 0.0001 87.33 < 0.0001 Table 5. Univariate and multivariate linear regression analysis for variables associating with the length of hospital stay.
-
Parameter HBsAg (+) (n = 13) HBsAg (-)(n = 89) P value Age (years) 54.4 ± 3. 5 55.5 ± 1.5 0.7526 Discharge days 24.2 ± 4.0 18.4 ± 1.8 0.0318 ALT, × ULN 16.6 ± 5.6 21.3 ± 2.1 0.3099 AST, × ULN 25.1 ± 9.5 20.8 ± 3.3 0.7191 ALP, × ULN 1.7 ± 0.2 1.5 ± 0.1 0.5041 GGT, × ULN 3.2 ± 0.5 3.8 ± 0.3 0.6391 TBIL, × ULN 8.0 ± 2.0 5.4 ± 0.4 0.2403 1Results are presented as mean ± SEM Table 6. Demographic and baseline clinical parameters comparison of inpatients with or without HBV carriage1.
Figure 4 个
Table 6 个