-
-
-
P value, median (ICQ) Diabetes Hypertension −
(n = 84)+
(n = 15)−
(n = 65)+
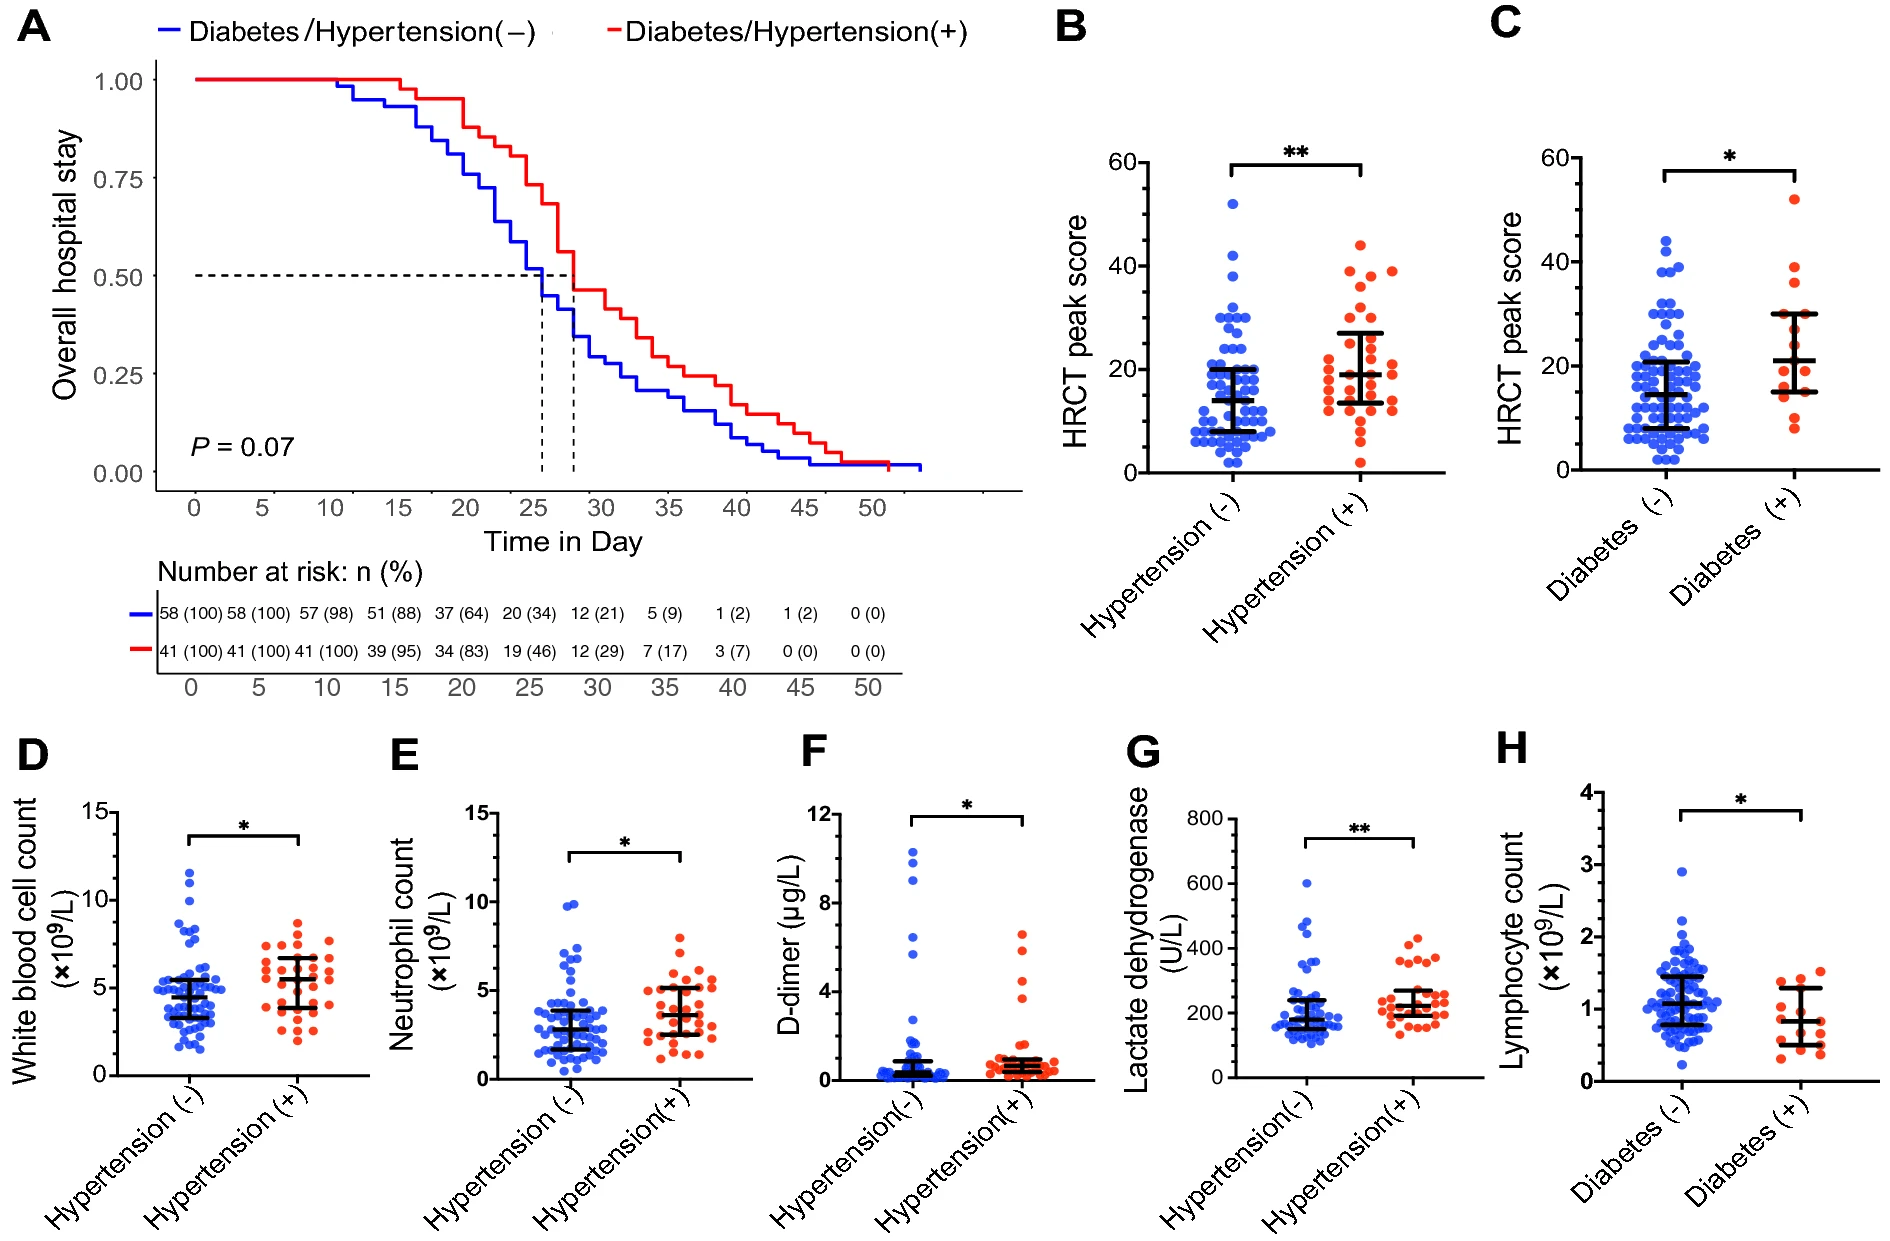
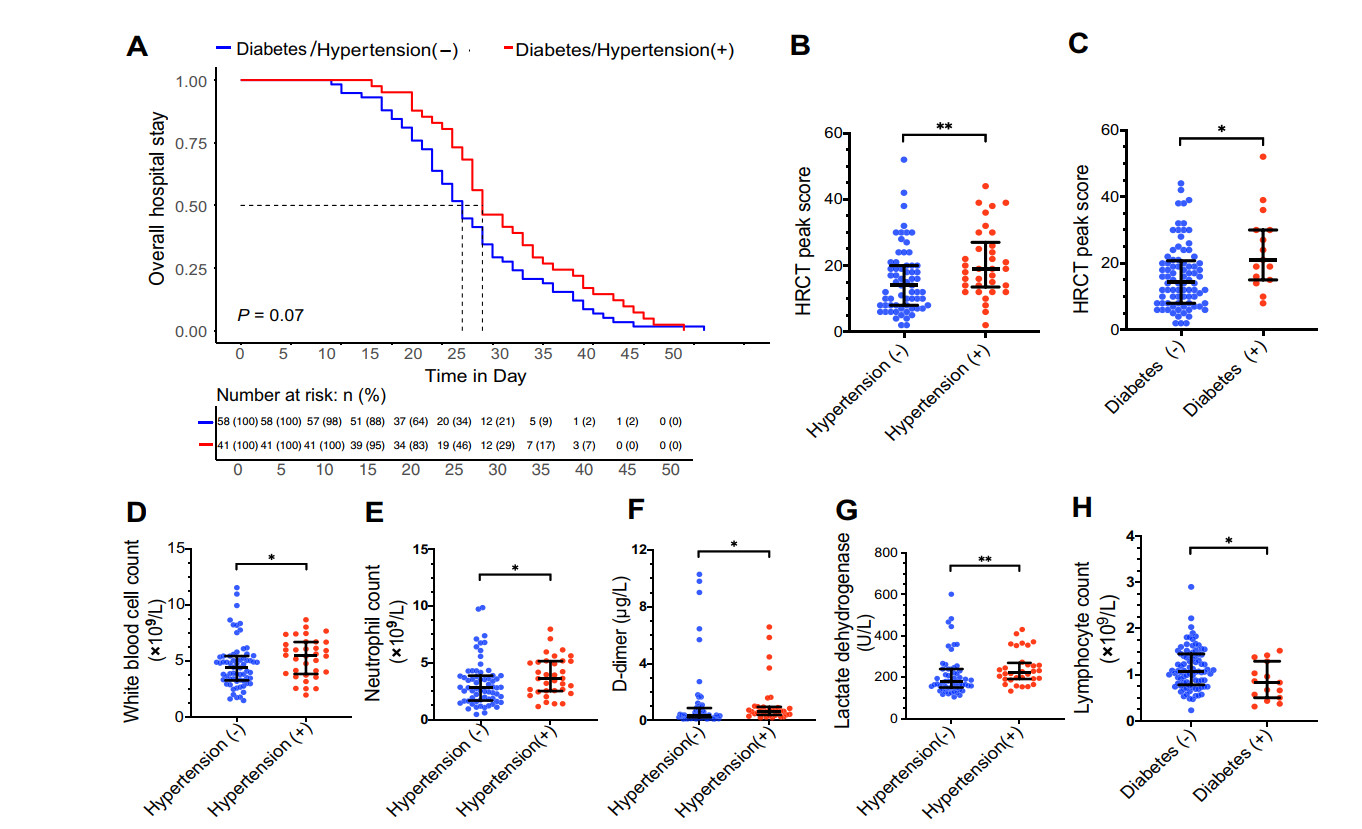
(n = 34)Demographics Age 0.2725 0.0030 Sex 0.8578 0.9846 Signs and symptoms Fever 1.0000 1.0000 Cough 0.1877 0.2292 Dyspnea 1.0000 0.7422 Anorexia and/or lethargy 1.0000 0.4944 Fatigue 0.9510 1.0000 Myalgia and/or arthralgia 1.0000 0.6506 Diarrhoea 0.7846 0.6871 Laboratory findings White blood cell count (× 109/L) 0.8224 0.0351 4.87
(3.52–5.69)4.11
(3.23–6.12)4.47
(3.32–5.46)5.50
(3.94–6.65)Neutrophil count (× 109/L) 0.6676 0.0450 2.93
(1.96–4.28)3.25
(2.21–4.67)2.81
(1.73–3.87)3.62
(2.54–5.12)Lymphocyte count (× 109/L) 0.0192 0.2595 1.08
(0.80–1.45)0.83
(0.54–1.16)1.09
(0.77–1.45)0.96
(0.70–1.31)D- dimer (μg/L) 0.0531 0.0166 0.38
(0.24–0.82)0.56
(0.44–1.11)0.36
(0.21–0.80)0.66
(0.41–0.93)Lactate dehydrogenase (U/L) 0.1337 0.0070 191.0
(157.0–242.5)215.0
(195.0–258.0)180.0
(151.5–240.0)222.5
(192.5–263.2)C- reactive protein (mg/dL) 0.9086 0.1421 1.70
(0.52–4.07)2.41
(0.34–4.78)1.37
(0.51–3.24)2.69
(0.53–5.84)Radiographic findings HRCT peak score 0.0119 0.0088 14.5
(8.0–20.3)21.0
(15.5–30.0)14.0
(8.0–20.0)19.0
(14.0–25.8)Data are P values. Medians and IQR (interquartile range) are also provided for laboratory and radiographic findings. P values were calculated by Mann–Whitney U test or Chi squared test as appropriate using R (V3.6.1) or GraphPad Prism (V8.2.1). Numbers in bold mean P values less than 0.05 and are statistically significant. Table 1. Comparisons of demographic, clinical, laboratory and radiographic findings in COVID-19 patients with diabetes or hypertension.
Figure 2 个
Table 1 个