-

-

-

-
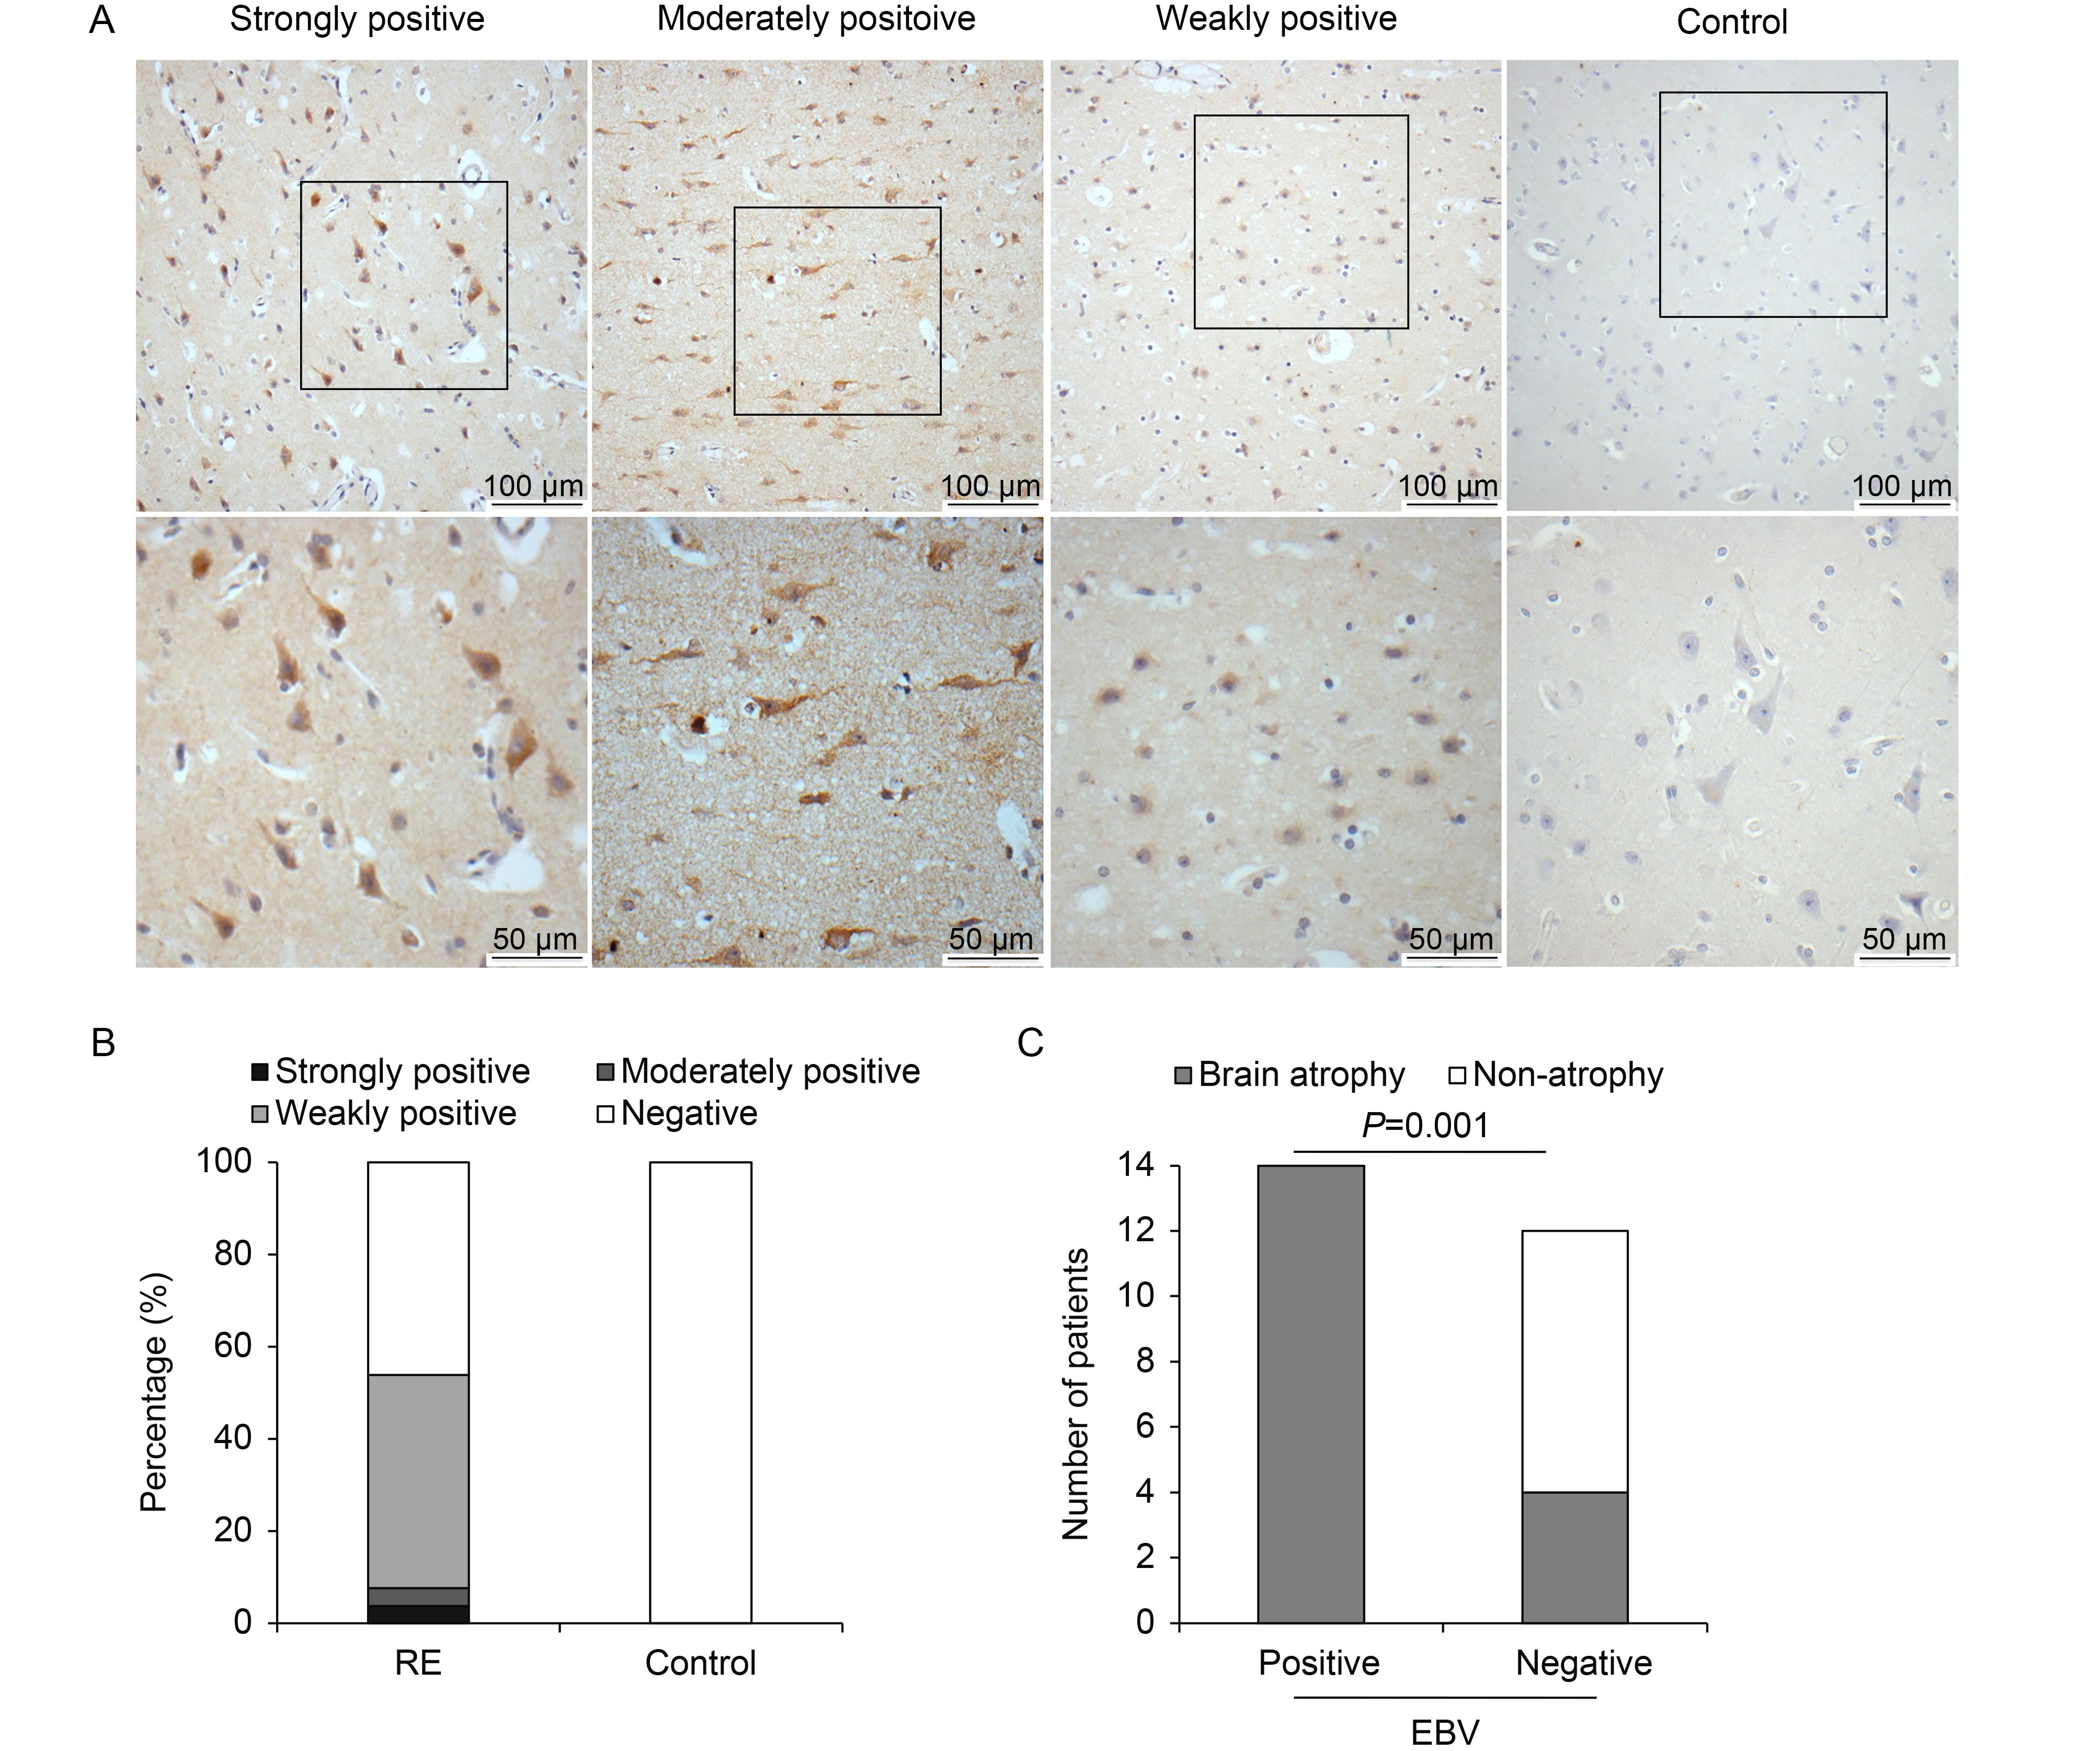
No. cases (%) Total +++ ++ + RE (n = 26) 1 (3.85) 1 (3.85) 12 (46.15) 14 (53.85) Control (n = 16) 0 (0) 0 (0) 0 (0) 0 (0) Note: +++: Strongly positive; ++: Moderately positive; +: Weakly positive. Table 1. Expression of EBV antigen in brain tissues of RE patients
-
Brain atrophy Non-atrophy Total EBV-positive cases 14 0 14 EBV-negative cases 4 8 12 Total 18 8 26 Note: Fisher’s exact test: P = 0.001. Table 2. Association between brain atrophy and EBV antigen expression in brain tissues of RE patients
-
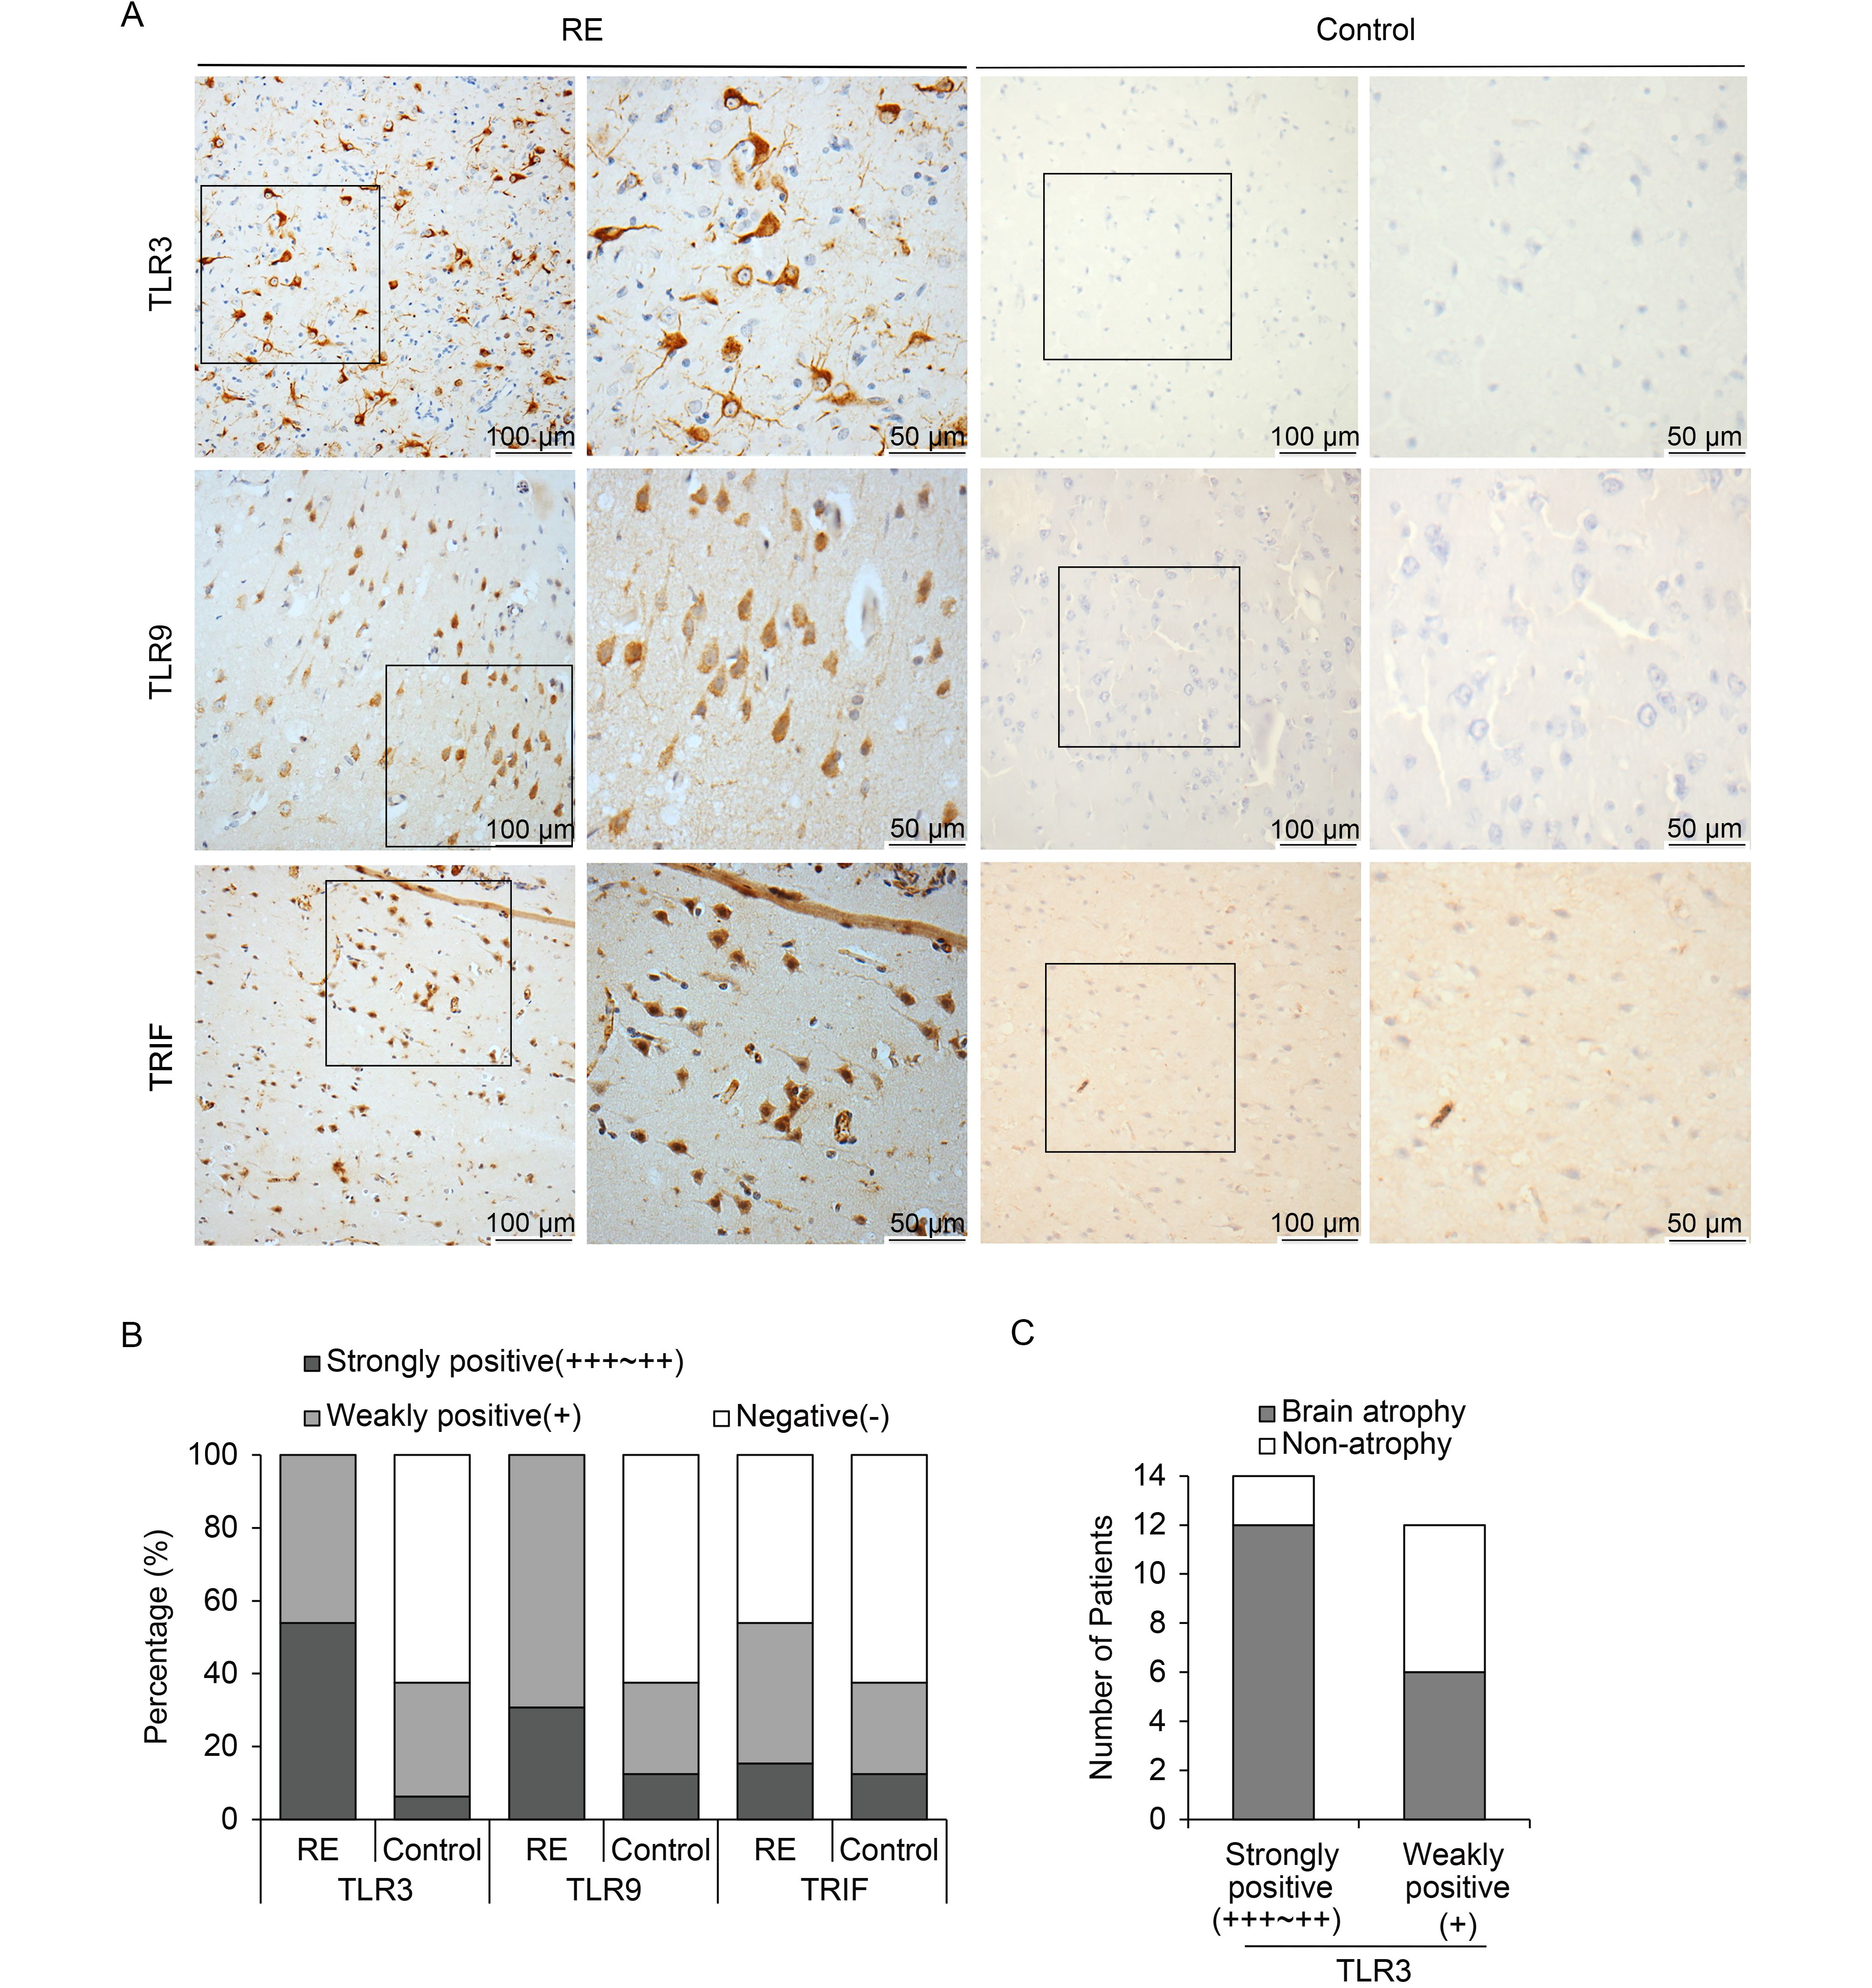
No. cases (%) Total +++/++ + TLR3 RE 14 (53.85) 12 (46.15) 26 (100) Control 1 (6.25) 5 (31.25) 6 (37.5) TLR9 RE 8 (30.77) 18 (69.23) 26 (100) Control 2 (12.5) 4 (25) 6 (37.5) TRIF RE 4 (15.38) 10 (38.46) 14 (53.85) Control 2 (12.5) 4 (25) 6 (37.5) Note: RE group: n = 26; Control group: n = 16; Strongly positive: +++/++; Weakly positive: +. Table 3. Expression of TLRs in brain tissues of RE patients
-
Brain atrophy cases Non-atrophy cases Total +++/++ 12 2 14 + 6 6 12 Total 18 8 26 Note: Strongly positive: +++/++; Weakly positive: +; Fisher’s exact test: P = 0.090. Table 4. Association between brain atrophy and TLR3 expression levels in brain tissues of RE patients
Figure 3 个
Table 4 个