-
-

-
-
-
Conventional cell lines Organoids CRC Sample size Surgical Small to big Tiny to big Timing 1–5 months 1–5 weeks 1–10 days Success rate of initiation (%) (0–10) ++ (5–80) +++ (50–100) Rapid expansion +++ ++ +++ Karyotypic stability + ++ ++ 3D growth – ++ – Genetic manipulation +++ ++ ++ Low throughput drug screens +++ ++ +++ High throughput drug screens +++ ++ +++ Heterogeneity − ++ ++ Cell biology + +++ +++ Cost + ++ + "–" "+" "++" and "+++" indicate "unsuitable or not applicable", "possible", "suitable", and "best" for the aspects or applications except for "cost". "+" and "++" represent "low" and "high" for in "cost" line, respectively. Table 1. Comparison of ex vivo cell models.
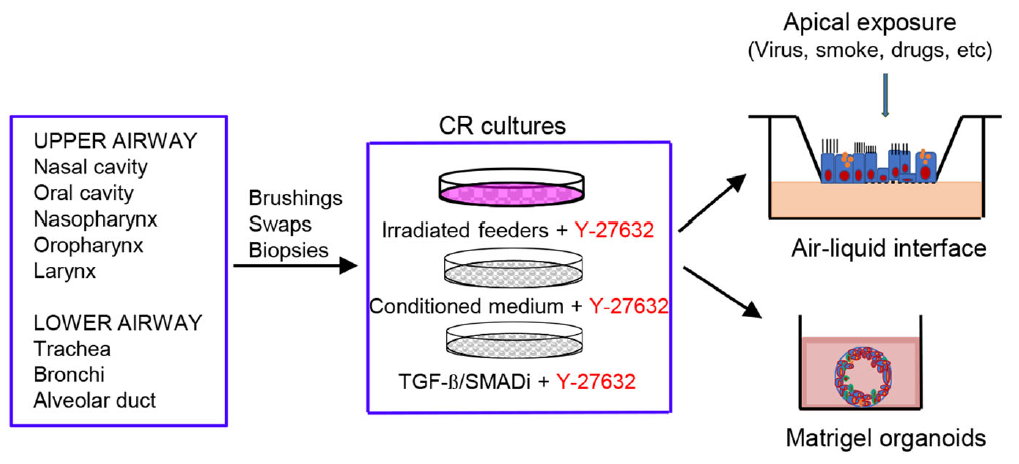
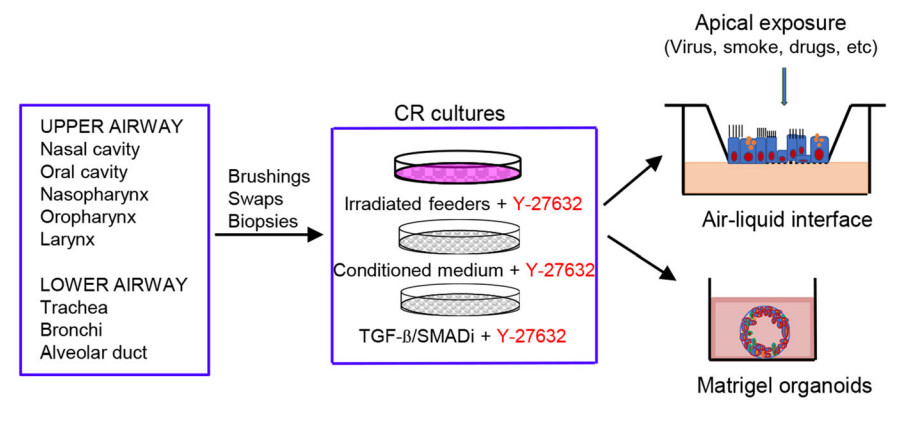
Figure 4 个
Table 1 个