-

-
-
-
-
-
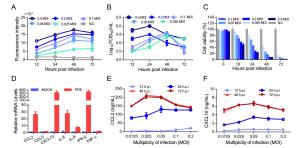
Name Cell-type Signal to background ratio (SBR)a NAb CCL2c CXCL10c IL-8c IL-6c A549 Lung epithelial cell line 2.3±0.5 1.6±0.1 1.5±0.3 1.9±0.1 3.6±0.1 THP-1 Monocyte cell line 5.8±2.1 3.2±0.7 1.7±0.2 2.0±0.2 1.2±0.1 iTHP-1d Macrophage-like cell 1.5±0.6 1.4±0.2 3.4±0.2 1.2±0.1 1.1±0.1 U937 Monocyte cell line 7.3±1.1 16.2±2.5 23.6±3.3 17.9±2.3 13±3.7 iU937d Macrophage-like cell 2.4±0.7 1.1±0.1 2.5±0.2 1.2±0.2 1.6±0.2 HL-60 Promyeloblast 6.1±0.6 13.0±2.7 1.2±0.2 4.4±0.1 1.3±0.3 iHL-60e Neutrophil-like cell 4.1±0.4 1.4±0.3 1.0±0.1 2.2±0.3 13.2±2.6 aCells were incubated with 0.1 MOI of A/PuertoRico/8/1934 (H1N1) influenza virus and tested for the signal to background ratios (SRBs) at 48 h post infection. The SBR was calculated from the fluorescence value of the infected wells (signal) divided by the uninfected control wells (background) for each assay. b NA (neuraminidase), measured by neuraminidase activity assay, represents the replication level of the influenza virus. cCytokine expression was measured by AlphaLISA. diU937 and iTHP-1 cells were prepared from U937 and THP-1 cells induced by 100 ng/mL TPA for 24 h. eiHL-60 was prepared from HL-60 induced by 1.25% DMSO for 5 days. Table 1. Identification of U937 cell line as a cell-based model for drug discovery against cytokines induced by influenza virus infection.
-
Chemical
nameCC50a IC50b
NASId
NAIC50c
CCL2IC50c
CXCL10SId
CCL2SId
CXCL10Target and possible mechanisme In vivo f Referencesg Ibrutinib 26.5 –h – 0.62 0.96 42.7 27.6 TPK inhibitor +i Florence et al.(2018) Vorapaxar > 80 – – 5.2 13.3 > 15.4 > 6 PAR1 antagonist + Khoufache et al.(2013) Ozanimod 26 – – 7.7 10.7 3.4 2.4 S1PR1 agonist + Teijaro et al. (2011) Ascomycin 62 21.3 2.9 8.1 9.9 7.7 6.3 Macrolides antibiotics + Sato et al. (1998) Ribavirin > 160 26.2 > 6.1 – – – – Anti-influnenza + Smee et al. (2008) Oseltamivir > 100 0.58 > 172.4 – – – – Anti-influnenza + Tsai et al. (2015) Rosiglitazone > 100 – – – – – – PPARγ agonist + Moseley et al.(2010) Etoricoxib > 50 – – – – – – COX-2 inhibitor ±j Zheng et al. (2008) Ibuprofen > 50 – – – – – – COX non-selective inhibitor ± Lauder et al. (2011) aCC50: 50% cytotoxic concentration (μmol/L) determined by MTS assay. bNA IC50: 50% inhibition concentration (μmol/L) determined by NA activity assay. cCCL2/CXCL10 IC50: 50% inhibition concentration (μmol/L) determined by AlphaLISA. dSI (Selective Index): a ratio of CC50/ IC50. eTarget and possible mechanism attributed to the compound as stated on either its "label" or literature. fIn vivo: the protective effect of mice from lethal influenza infection. gRef.: the reference of the reported protection effect of antiviral or immunomodulation agents in vivo. h"–": lower than 50% inhibition or not effective. i"+": Agent used alone can protect mice against lethal influenza virus infection according to the literature. j"±": Agent is effective in combination therapy, but when used alone cannot protect mice against lethal influenza virus infection. Table 2. Validation of U937 cell model with a panel of antiviral and immunomodulatory agents.
-
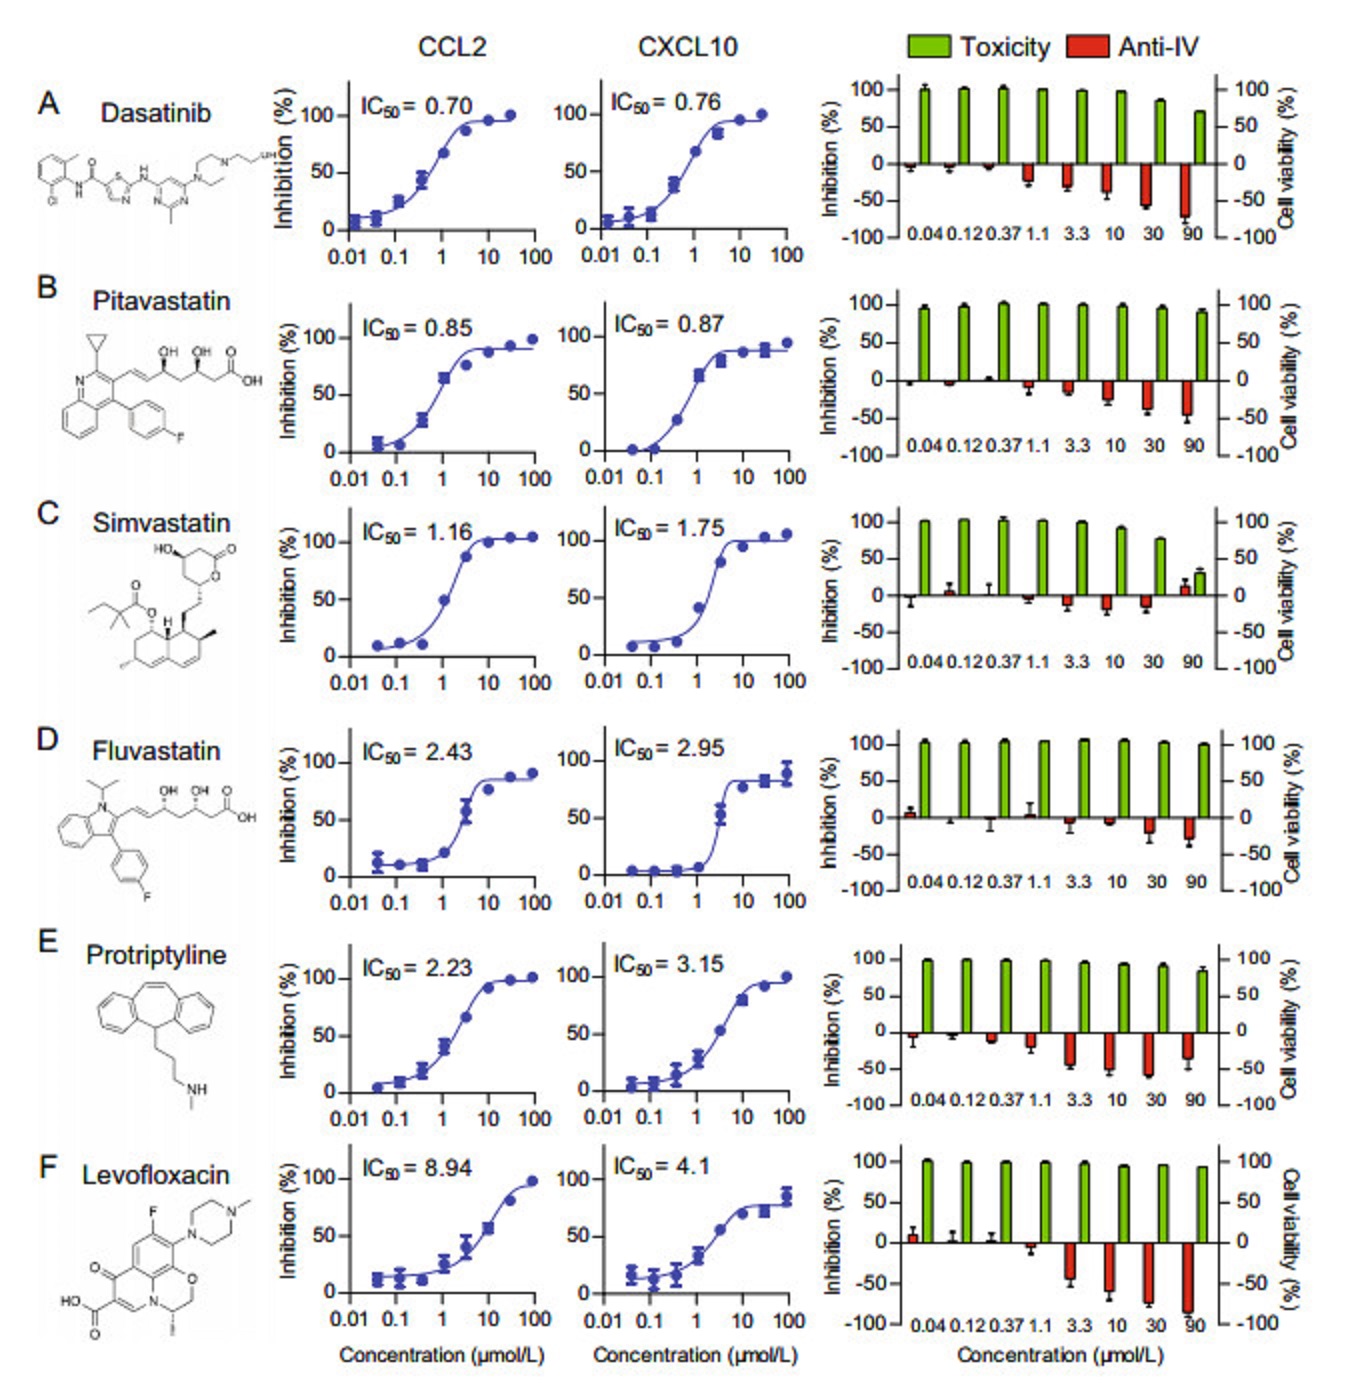
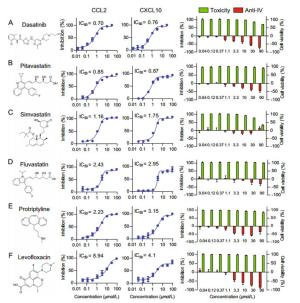
Chemical name IC50
CCL2IC50
CXCL10CC50 SI
CCL2SI
CXCL10Approved of intended use Possible mechanism and target Dasatinib 0.63 0.71 > 90 > 142.9 > 126.8 Antineoplastic Tyrosine-protein kinases inhibitor Pitavastatin 0.85 0.87 > 90 > 105.9 > 103.4 Antilipemic HMG-CoA reductase inhibitor Simvastatin 1.16 1.75 66.8 57.6 38.2 Antilipemic HMG-CoA reductase inhibitor Fluvastatin 2.43 2.95 > 90 > 37.0 > 30.5 Antilipemic HMG-CoA reductase inhibitor Protriptyline 2.23 3.15 > 90 > 40.4 > 28.6 Antidepressant Serotonin reuptake inhibitor Levofloxacin 8.94 3.12 > 90 > 10.1 > 28.8 Antibiotic DNA gyrase and topoisomerase IV inhibitor Table 3. Six compounds were confirmed to inhibit influenza-induced CCL2/CXCL10 expression in U937 cell model.
Figure 5 个
Table 3 个