-

-

-
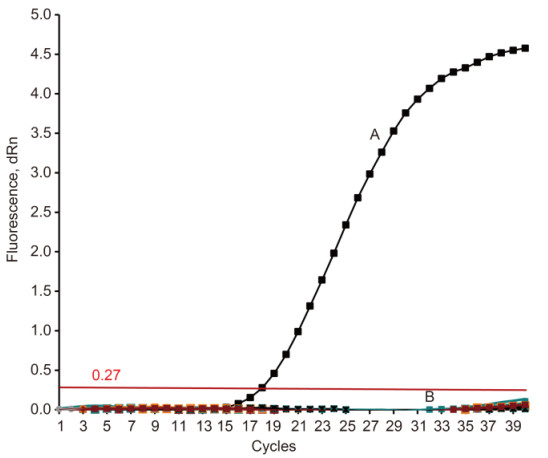
Dilution TCID50/mL Average Ctvalue±standard deviationa 10−1 2.32 × 10³ 21.34±0.07 10−2 2.32 × 10² 24.53±0.10 10−3 2.32 × 101 28.12±0.39 10−4 2.32 × 100 31.38±0.17 10−5 2.32 × 10⁻¹ 39.51±0.21 10−6 2.32 × 10⁻² No Ct 10−7 2.32 × 10⁻³ No Ct 10−8 2.32 × 10⁻⁴ No Ct Negative controlb - No Ct Note:a: The Ct values were calculated based on the dRn threshold of 0.27 adapted from (Ben Shabat et al., 2010); b: DEPC treated water. Table 1. Detection limits of viral load for a Eurasian-lineage H10 specific quantitative RT-PCR method
-
Host Virus name Human A/Puerto Rico/8/1934(H1N1) A/California/04/2009(H1N1) A/Brisbane/10/2005(H3N2) A/Perth/16/2009(H3N2) Avian A/mallard/Oregon/A00544081/2008(H1N1) A/mallard/Wisconsin/A00751454/2009(H1N1) A/mallard/Oregon/A00300758/2008(H2N3) A/mallard/Oregon/A00320372/2007(H2N3) A/mallard/Wisconsin/A00661712/2009(H3N2) A/mallard/Wisconsin/A00714818/2009(H3N2) A/mallard/Colorado/A00170379/2006(H3N8) A/mallard/Wisconsin/A00170366/2006(H3N8) A/mallard/Washington/A00714770/2009(H4N6) A/mallard/Washington/A00757090/2009(H4N6) A/chicken/Jiangxi/JXA132321/2013(H5N?)a A/mallard/Colorado/A00551322/2007(H6N1) A/mallard/New York/A00603000/2009(H6N1) A/blue-winged teal/Illinois/10OS3610/2010(H6N2) A/mallard/Ohio/81/1986(H6N2) A/mute swan/Rhode Island/A00325114/2008(H7N3) A/american green-winged teal/Utah/A00461135/2009(H7N1) A/northern shoveler/Mississippi/A00630207/2009(H7N6) A/chicken/Jiangxi/JXA132304/2013(H9N2)a A/mallard/South Dakota/A00536114/2007(H10N7) A/mallard/New York/A00919062/2009(H10N7) A/chicken/Jiangxi/JXA132717/2013 (H10N8)a Avian Newcastle disease virus (strain 2013 pt#3-3) Infectious bursal disease virus (strain P13-03308) Infectious bronchitis virus (strain P14-00957ct) Reovirus (strain P14-00932) Note:a: The RNA from these viruses was extracted directly from a clinical swab sample; for all others viruses, the RNA was extracted from virus isolates. Table S1. Viruses used to determine the specificity of a Eurasian-lineage H10 specific quantitative RT-PCR method
Figure 2 个
Table 2 个