-
-
-
-
-
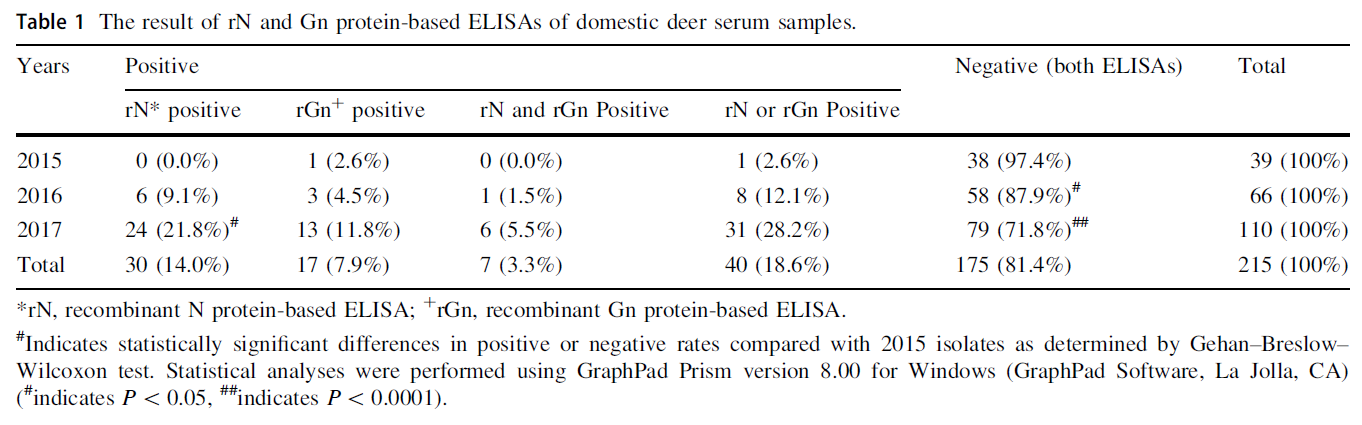
Years Positive Negative (both ELISAs) Total rN* positive rGn+ positive rN and rGn Positive rN or rGn Positive 2015 0 (0.0%) 1 (2.6%) 0 (0.0%) 1 (2.6%) 38 (97.4%) 39 (100%) 2016 6 (9.1%) 3 (4.5%) 1 (1.5%) 8 (12.1%) 58 (87.9%)# 66 (100%) 2017 24 (21.8%)# 13 (11.8%) 6 (5.5%) 31 (28.2%) 79 (71.8%)## 110 (100%) Total 30 (14.0%) 17 (7.9%) 7 (3.3%) 40 (18.6%) 175 (81.4%) 215 (100%) *rN, recombinant N protein-based ELISA; +rGn, recombinant Gn protein-based ELISA.
#Indicates statistically significant differences in positive or negative rates compared with 2015 isolates as determined by Gehan–Breslow– Wilcoxon test. Statistical analyses were performed using GraphPad Prism version 8.00 for Windows (GraphPad Software, La Jolla, CA) (#indicates P < 0.05, ##indicates P < 0.0001).Table 1. The result of rN and Gn protein-based ELISAs of domestic deer serum samples.
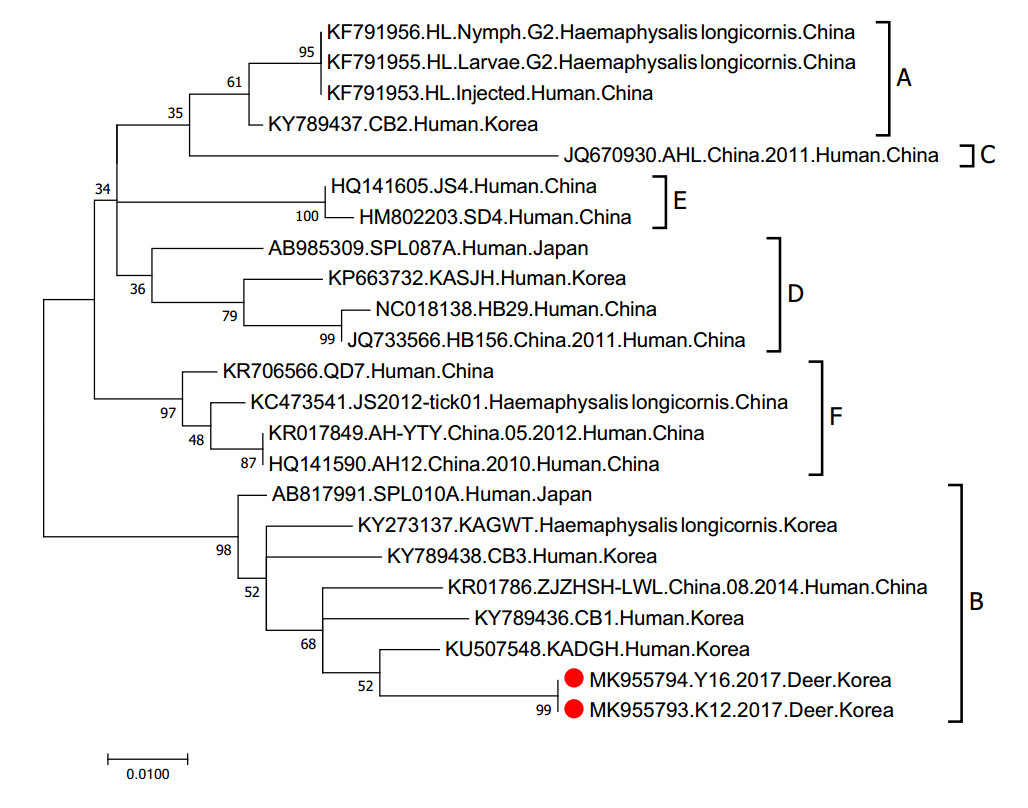
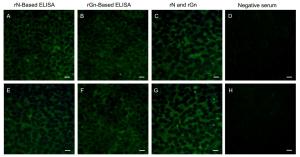
Figure 4 个
Table 1 个