-
-
-
-
-
-
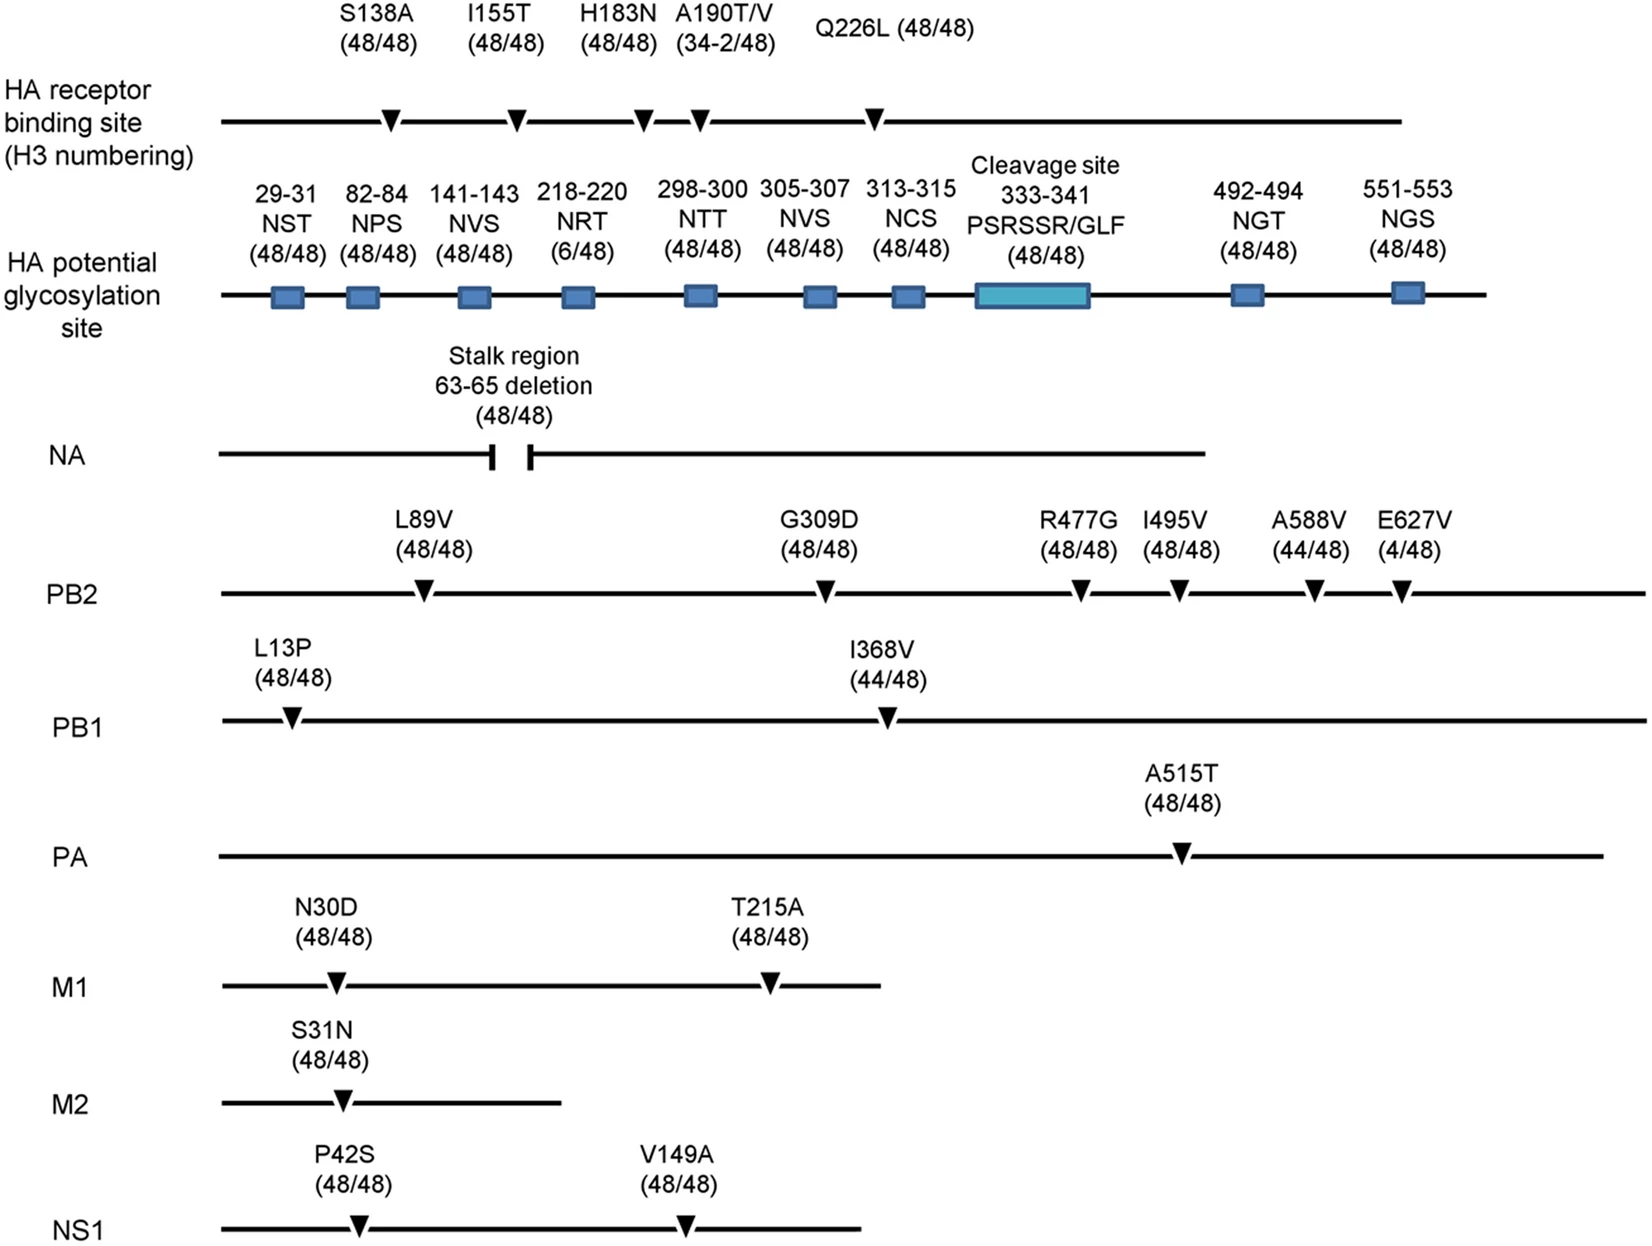
Samples (n) Influenza A (%) H5 (%) H7 (%) H9 (%) H5 + H9 (%) Chicken 3036 763 (25.1) 54 (1.9) 10 (0.3) 575 (18.9) 63 (2.1) Duck 1261 399 (31.6) 79 (6.2) 0 43 (3.4) 61 (4.8) Pigeon 35 2 (5.7) 0 0 2 (5.7) 0 Goose 10 0 0 0 0 0 Environment 456 111 (24.3) 16 (3.5) 7 (1.5) 21 (4.6) 34 (7.4) Total 4798 1275 (26.6) 149 (3.1) 17 (0.4) 641 (13.4) 158 (3.3) Table 1. Detection of influenza A viruses by real-time RT-PCR in samples from live poultry markets in Hubei Province.
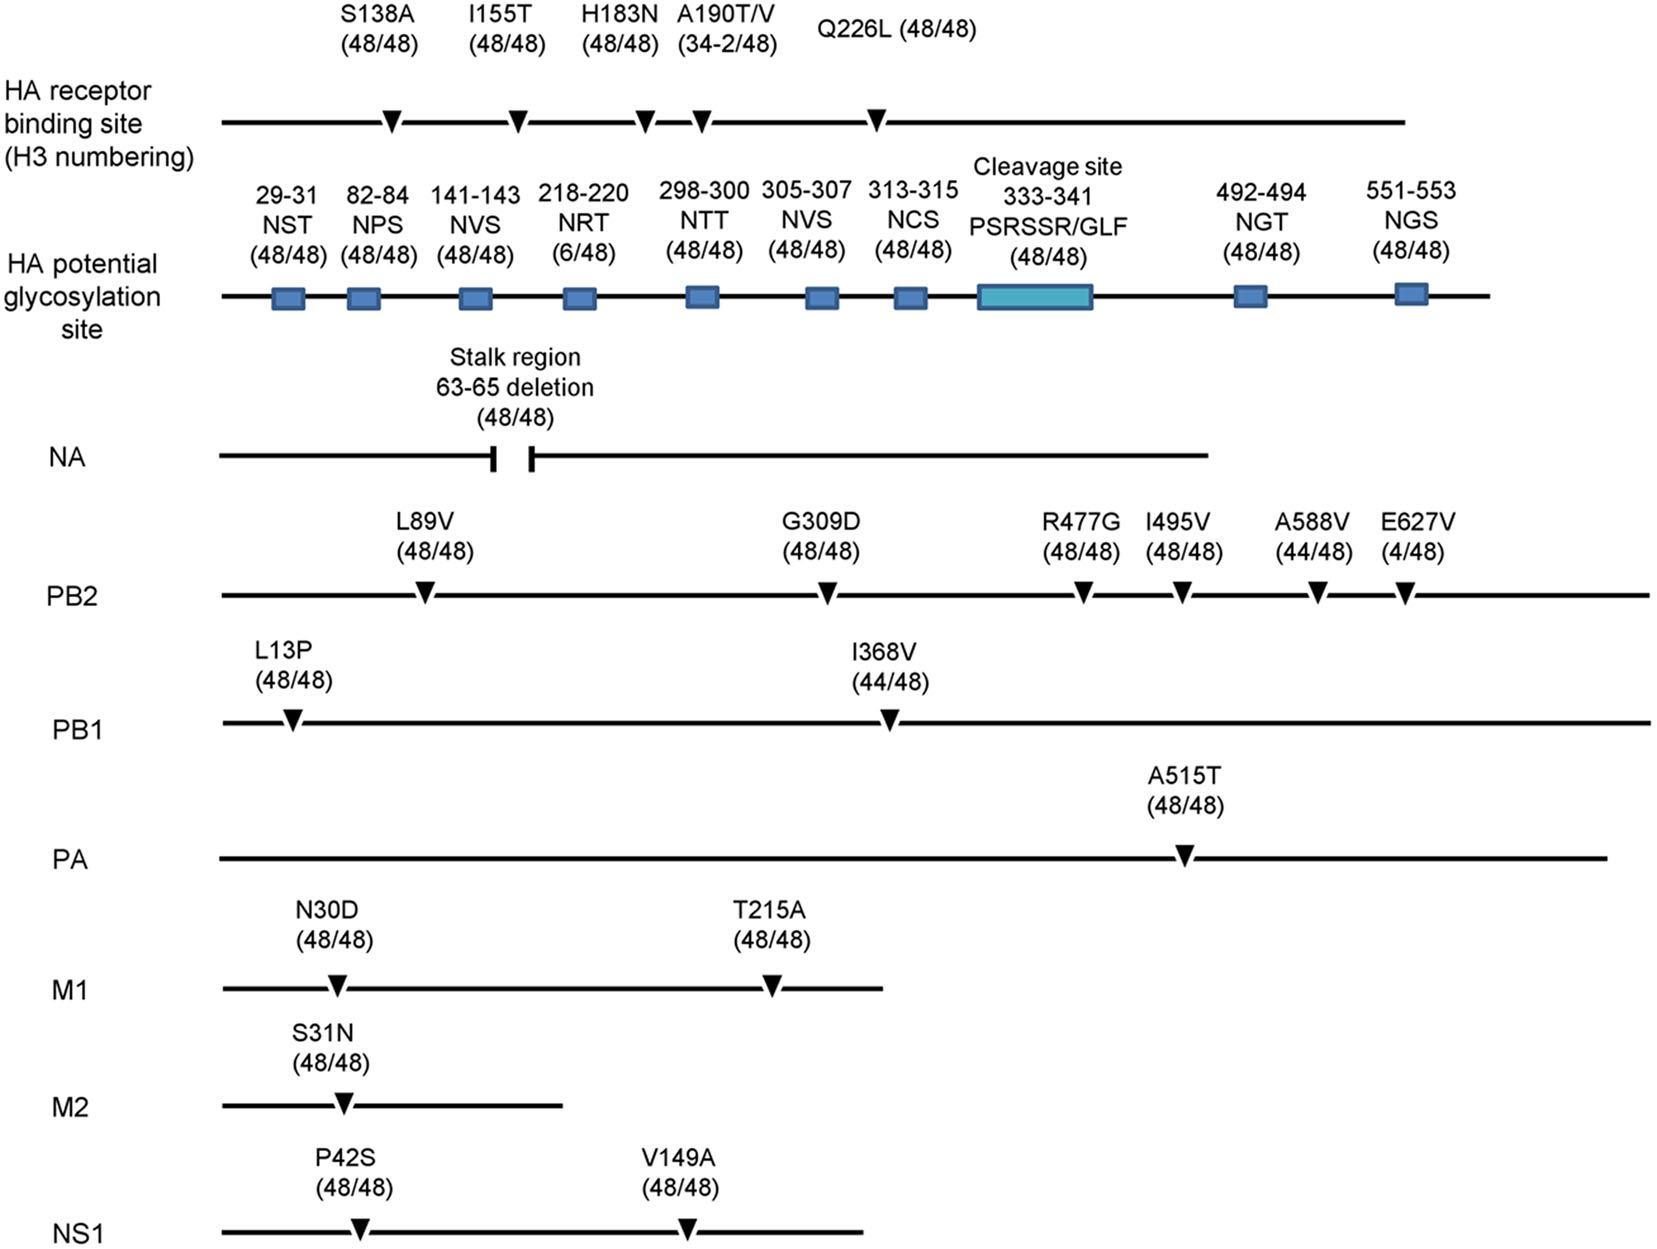
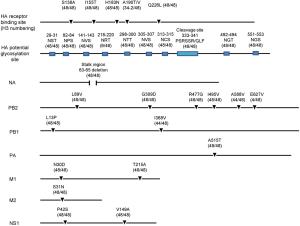
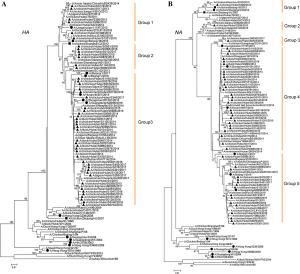
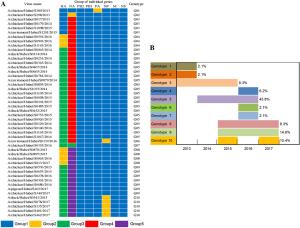
Figure 5 个
Table 1 个