-

-
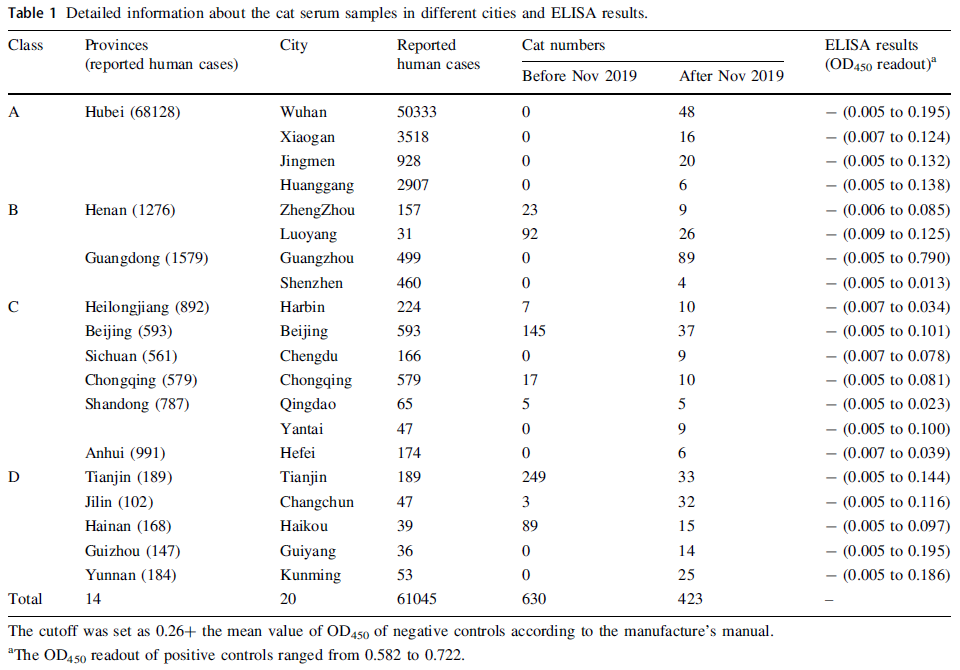
Class Provinces (reported human cases) City Reported human cases Cat numbers ELISA results (OD450 readout)a Before Nov 2019 After Nov 2019 A Hubei (68128) Wuhan 50333 0 48 − (0.005 to 0.195) Xiaogan 3518 0 16 − (0.007 to 0.124) Jingmen 928 0 20 − (0.005 to 0.132) Huanggang 2907 0 6 − (0.005 to 0.138) B Henan (1276) ZhengZhou 157 23 9 − (0.006 to 0.085) Luoyang 31 92 26 − (0.009 to 0.125) Guangdong (1579) Guangzhou 499 0 89 − (0.005 to 0.790) Shenzhen 460 0 4 − (0.005 to 0.013) C Heilongjiang (892) Harbin 224 7 10 − (0.007 to 0.034) Beijing (593) Beijing 593 145 37 − (0.005 to 0.101) Sichuan (561) Chengdu 166 0 9 − (0.007 to 0.078) Chongqing (579) Chongqing 579 17 10 − (0.005 to 0.081) Shandong (787) Qingdao 65 5 5 − (0.005 to 0.023) Yantai 47 0 9 − (0.005 to 0.100) Anhui (991) Hefei 174 0 6 − (0.007 to 0.039) D Tianjin (189) Tianjin 189 249 33 − (0.005 to 0.144) Jilin (102) Changchun 47 3 32 − (0.005 to 0.116) Hainan (168) Haikou 39 89 15 − (0.005 to 0.097) Guizhou (147) Guiyang 36 0 14 − (0.005 to 0.195) Yunnan (184) Kunming 53 0 25 − (0.005 to 0.186) Total 14 20 61045 630 423 – The cutoff was set as 0.26+ the mean value of OD450 of negative controls according to the manufacture's manual.
aThe OD450 readout of positive controls ranged from 0.582 to 0.722.Table 1. Detailed information about the cat serum samples in different cities and ELISA results.
Figure 1 个
Table 1 个