-
-

-

-
Characteristic Group 1 (Urumqi) Group 2 (Kashgar) n (%) n (%) Total Number 700 594 Ethnicity Han 373 (53.3) 282 (47.5) Uygur 327 (46.7) 312 (52.5) Gender Male 364 (52.0) 244 (41.1) Female 336 (48.0) 350 (58.9) Median Age (years) 43 48 Education Elementary or below 273 (39.0) 330 (55.6) Junior high or beyond 427 (61.0) 264 (44.4) Population stationary population 437 (62.4) 507 (85.4) immigrated population 263 (37.6) 87 (14.6) Table 1. Characteristics of the study population
-
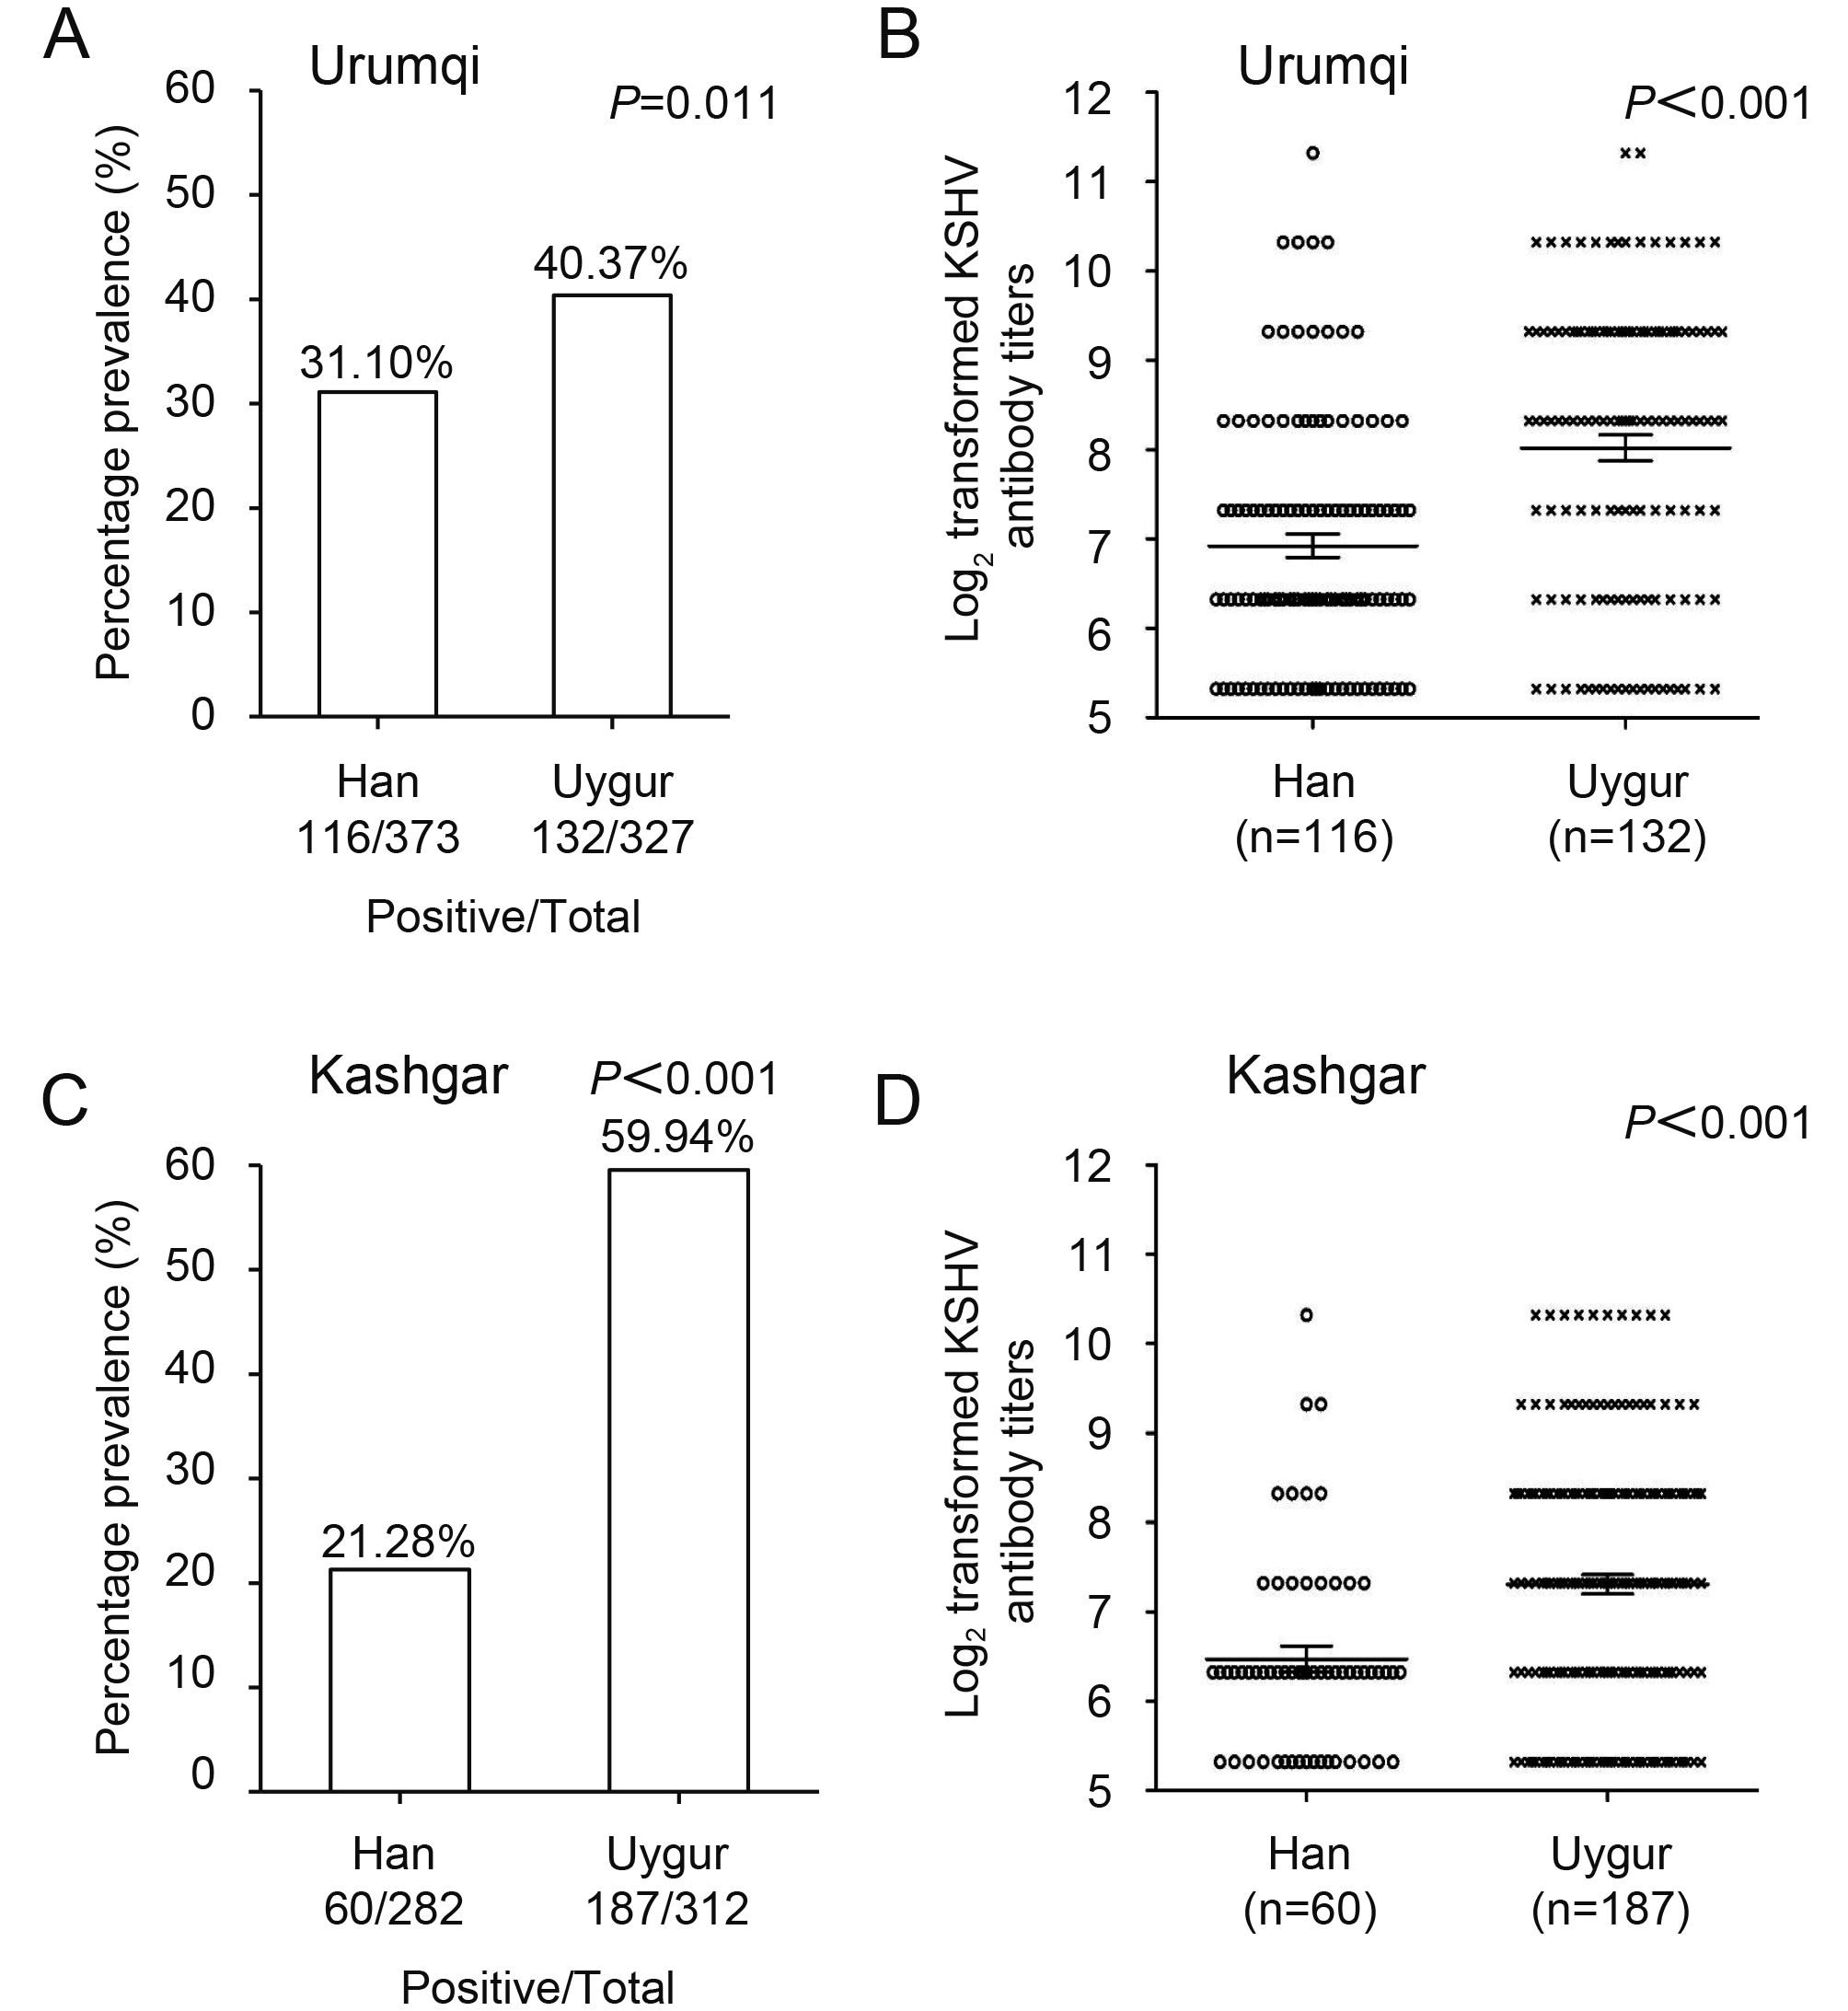
Characteristic Cases (n) Urumqi χ2 P Cases (n) Kashgar χ2 P KSHV + (%) KSHV - (%) KSHV + (%) KSHV - (%) Ethnicity Han 373 116 (31.1) 257 (68.9) 6.542 0.011 282 60 (21.3) 222 (78.7) 91.132 0.000 Uygur 327 132 (40.4) 195 (59.6) 312 187 (59.9) 125 (40.1) Gender Male 364 136 (37.4) 228 (62.6) 1.240 0.265 244 105 (43.0) 139 (57.0) 0.359 0.549 Female 336 112 (33.3) 224 (66.7) 350 142 (40.6) 208 (59.4) Age < 50 397 123 (31.0) 274 (69.0) 7.926 0.005 286 107 (37.4) 179 (62.6) 3.948 0.047 ≥ 50 303 125 (41.3) 178 (58.7) 308 140 (45.5) 168 (54.5) Education Elementary or below 273 109 (39.9) 164 (60.1) 3.958 0.047 330 155 (47.0) 175 (53.0) 8.871 0.003 Junior high or beyond 427 139 (32.6) 288 (67.4) 264 92 (34.8) 172 (65.2) Population Stationary population 437 168 (38.4) 269 (61.6) 4.623 0.032 507 225 (44.4) 282 (55.6) 11.142 0.001 Immigrated population 263 80 (30.4) 183 (69.6) 87 22 (25.3) 65 (74.7) Table 2. The associations of KSHV seroprevalence with population characteristics stratified by geographic region from Xinjiang, China
-
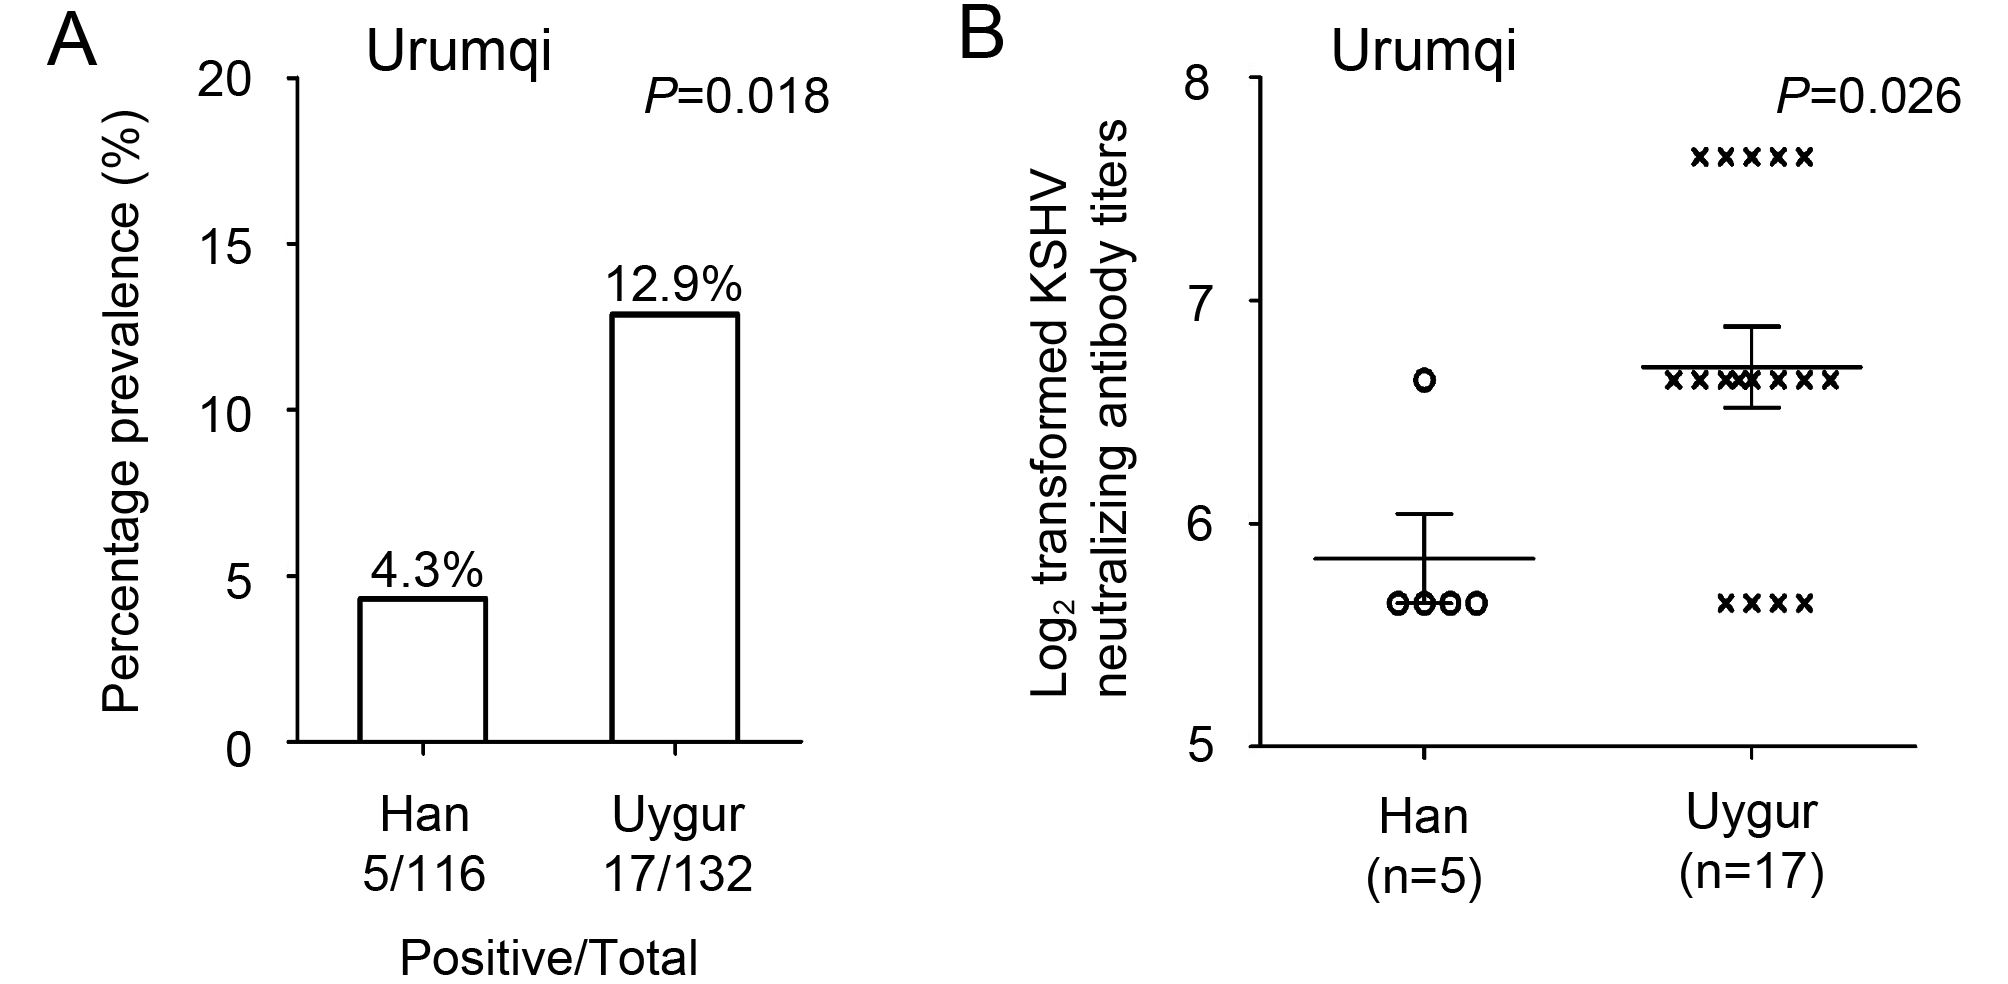
Characteristic Cases (n) KSHV + (%) KSHV - (%) χ2 P Ethnicity Han 373 65 (17.4) 308 (82.6) 9.178 0.002 Uygur 327 88 (26.9) 239 (73.1) Gender Male 364 72 (19.8) 292 (80.2) 1.915 0.166 Female 336 81 (24.1) 255 (75.9) Age < 50 397 75 (18.9) 322 (81.1) 4.722 0.030 ≥ 50 303 78 (25.7) 225 (74.3) Education Elementary or below 354 88 (24.9) 266 (75.1) 3.778 0.052 Junior high or beyond 346 65 (18.8) 281 (81.2) Population Stationary population 437 108 (24.7) 329 (75.3) 5.558 0.018 Immigrated population 263 45 (17.1) 218 (82.9) Table 3. The associations of KSHV DNA positive rate with population characteristics in Urumqi region of Xinjiang.
-

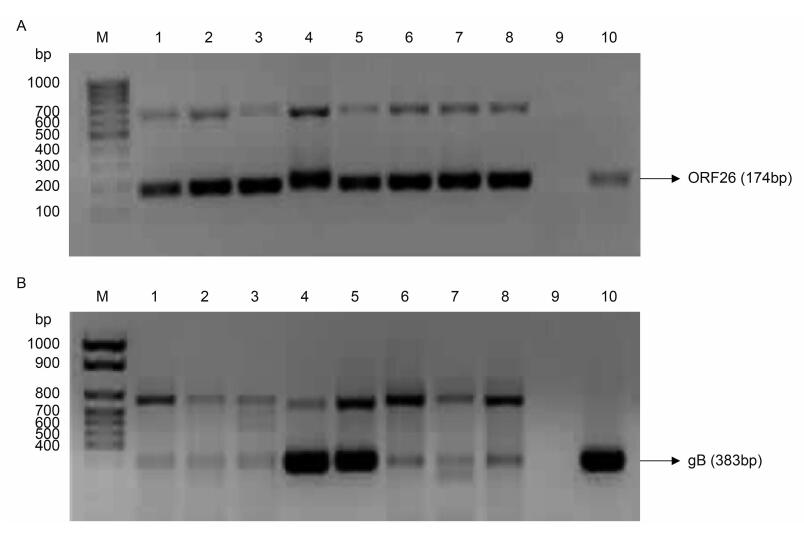
Table S1. Primer sequences
Figure 3 个
Table 4 个