-

-
-
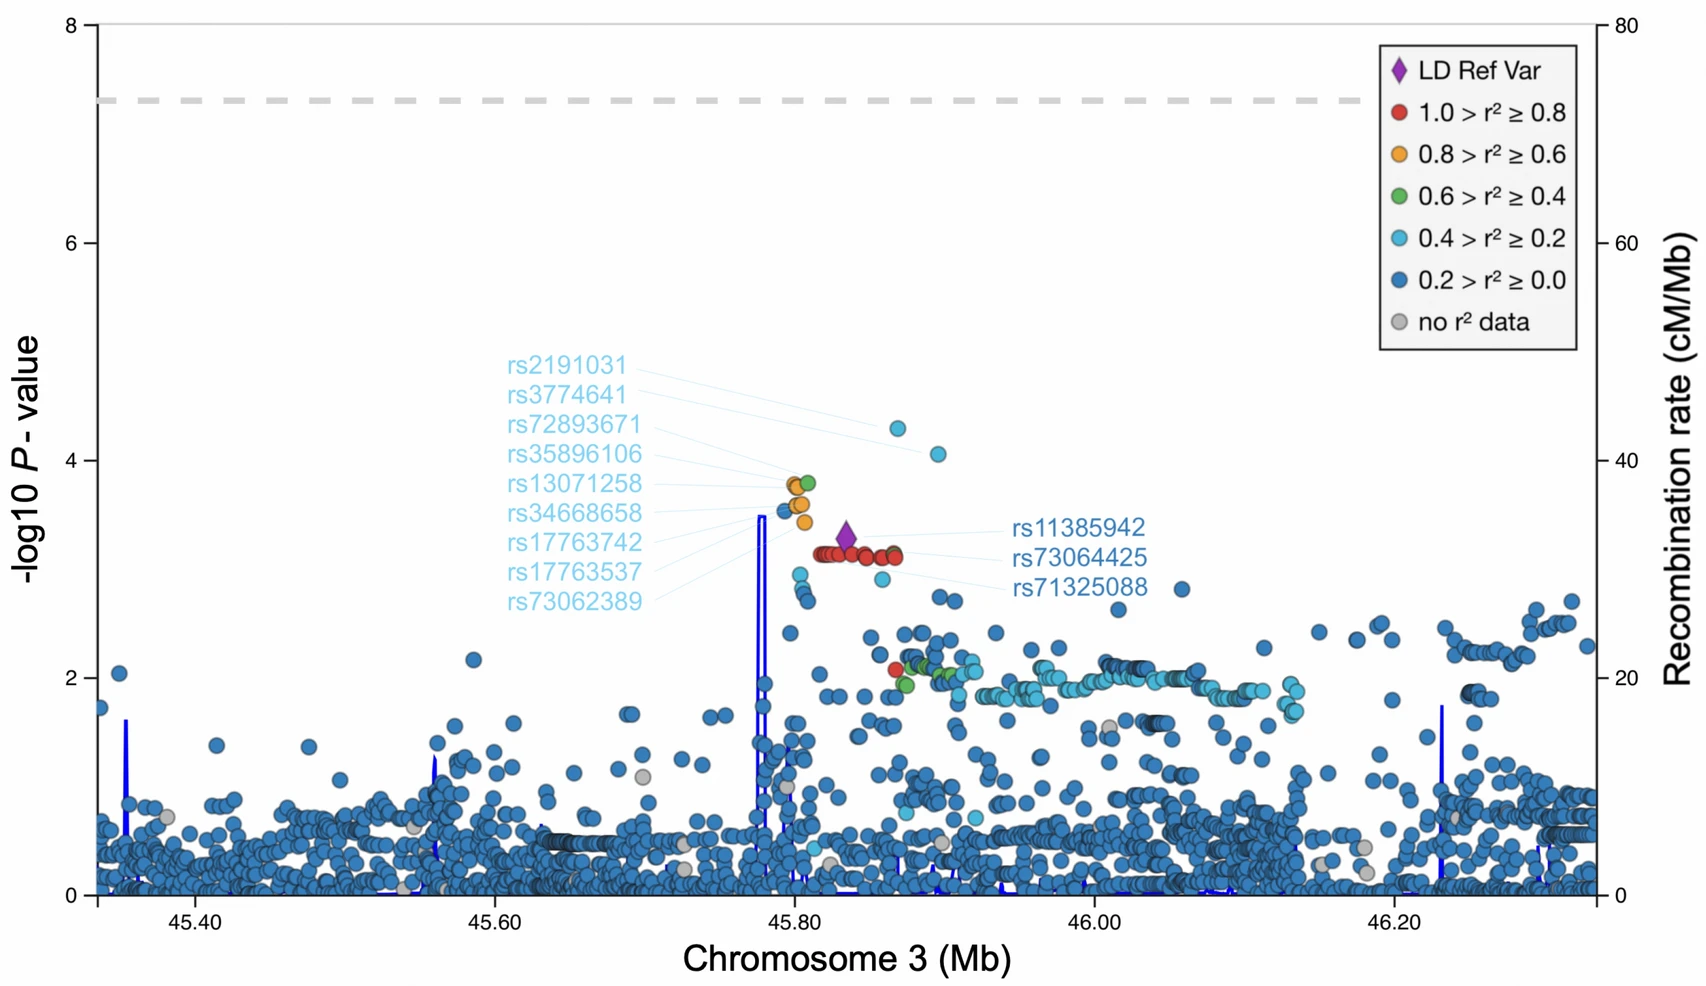
Chr SNP ID Risk allele Mapped genes COVID-19 patients (n = 475) vs. controls (n = 2217) Hospitalized COVID-19 patients (n = 146) vs. controls (n = 2217) P/Padj AF (case/ctrl) OR (95% CI) P/Padj AF (case/ctrl) OR(95% CI) GWAS catalog OR (95% CI) 3 rs71325088 C SLC6A20, LZTFL1 0.0007/0.007 0.13/0.09 1.46 (1.17–1.81) 0.00001/0.0001 0.16/0.09 2.10 (1.50–2.92) 1.9a (1.73–2.0) 3 rs11385942 A LZTFL1 0.0005/0.005 0.13/0.09 1.47 (1.18–1.82) 0.000006/0.00006 0.16/0.09 2.14 (1.54–2.99) 2.11b (1.70–2.61) 3 rs73064425 T AC099782.3, LZTFL1 0.0008/0.007 0.13/0.09 1.45 (1.17–1.80) 0.00001/0.00009 0.16/0.09 2.13 (1.52–2.97) 1.7a NR 6 rs143334143 A CCHCR1 0.7/1 0.09/0.09 0.94 (0.73–1.22) 0.4/1 0.10/0.09 1.18 (0.78–1.80) 1.3a (1.27–1.48) 9 rs657152 A ABO 0.1/0.891 0.47/0.44 1.13 (0.98–1.31) 0.1/1 0.48/0.44 1.22 (0.95–1.55) 1.32b (1.20–1.47) 12 rs6489867 C OAS1, AC004551.1 0.9/1 0.30/0.31 0.99 (0.85–1.16) 0.7/1 0.29/0.31 0.96 (0.73–1.25) 1.2a (1.14–1.25) 19 rs2109069 A DPP9 0.01/0.115 0.30/0.27 1.22 (1.04–1.44) 0.1/1 0.30/0.27 1.22 (0.94–1.59) 1.2a (1.19–1.31) 19 rs11085727 T TYK2 0.03/0.235 0.31/0.28 1.20 (1.02–1.40) 0.1/1 0.32/0.28 1.23 (0.95–1.60) 1.2a (1.18–1.31) 21 rs13050728 T AP000295.1, IFNAR2 0.6/1 0.39/0.38 1.04 (0.90–1.21) 0.06/1 0.43/0.38 1.28 (0.99–1.64) 1.2a (1.16–1.28) Bold represents the significant P-values after Bonferroni correction
aFromPairo-Castineira et al. 2021
bFrom The Severe COVID-19 GWAS Group 2020.
Bold represent the significant P-values. Chr, Chromosome number; SNP, Single nucleotide polymorphism; AF, Allele frequency; Padj, Bonferroni adjusted P-value; ctrl, controls; OR, Odds ratio; CI, Confidence interval; NR, not recordedTable 1. Association of the selected single nucleotide polymorphisms and SARS-CoV-2 infection
Figure 2 个
Table 1 个