-
-
-
-
-
-
-
2016.6–2017.5 2017.6–2018.5 2018.6–2019.5 Total P value Received samples (n) 4983 16, 625 23, 130 44, 738 Influenza type A B A + B A B A + B A B A + B A B A + B Age 741 (14.9) 213 (4.7) 16 (0.3) 2617 (15.7) 1332 (8.0) 60 (0.4) 3575 (15.5) 1202 (5.2) 58 (0.3) 6933 (15.5) 2747 (6.1) 134 (0.3) < 2 years 25 (3.4) 4 (1.9) 1 (6.3) 131 (5.0) 36 (2.7) 2 (3.3) 295 (8.3) 74 (6.2) 5 (8.6) 451 (6.5) 114 (4.2) 8 (6.0) P < 0.0001 2–4 years 286 (38.6) 64 (30.1) 7 (43.8) 991 (37.9) 331 (24.9) 21 (35.0) 1231 (34.4) 221 (18.4) 19 (32.8) 2508 (36.2) 616 (22.4) 47 (35.1) 5–14 years 372 (50.2) 131 (60.5) 7 (43.8) 889 (34.0) 696 (52.3) 31 (51.7) 1316 (36.8) 573 (47.7) 30 (51.7) 2577 (37.2) 1400 (51.0) 68 (50.8) 15–64 years 56 (7.6) 14 (6.6) 0 (0.0) 568 (21.7) 240 (18.0) 3 (5.0) 686 (19.2) 311 (25.9) 4 (6.9) 1310 (18.9) 565 (20.6) 7 (5.2) > 64 years 2 (0.3) 0 (0.0) 0 (0.0) 38 (1.5) 29 (2.2) 3 (5.0) 47 (1.3) 23 (1.9) 0 (0.0) 87 (1.3) 52 (1.9) 3 (2.2) A + B: Co-infection with FLUAV and FLUBV.
P < 0.0001: Differences in the distribution by age groups were found between FLUAV and FLUBV.Table 1. Prevalence of FLUV in Wuhan city, Hubei province, China during 2016–2019.
-
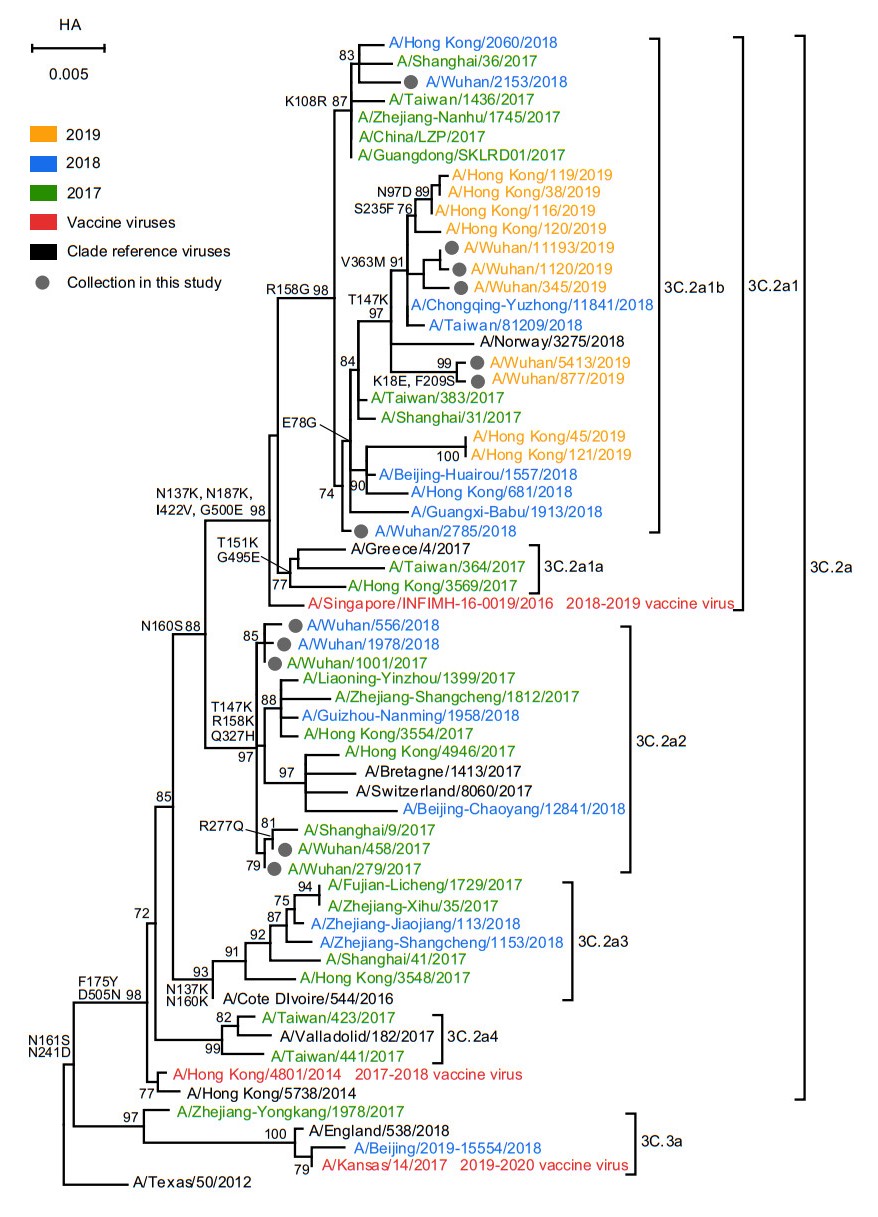
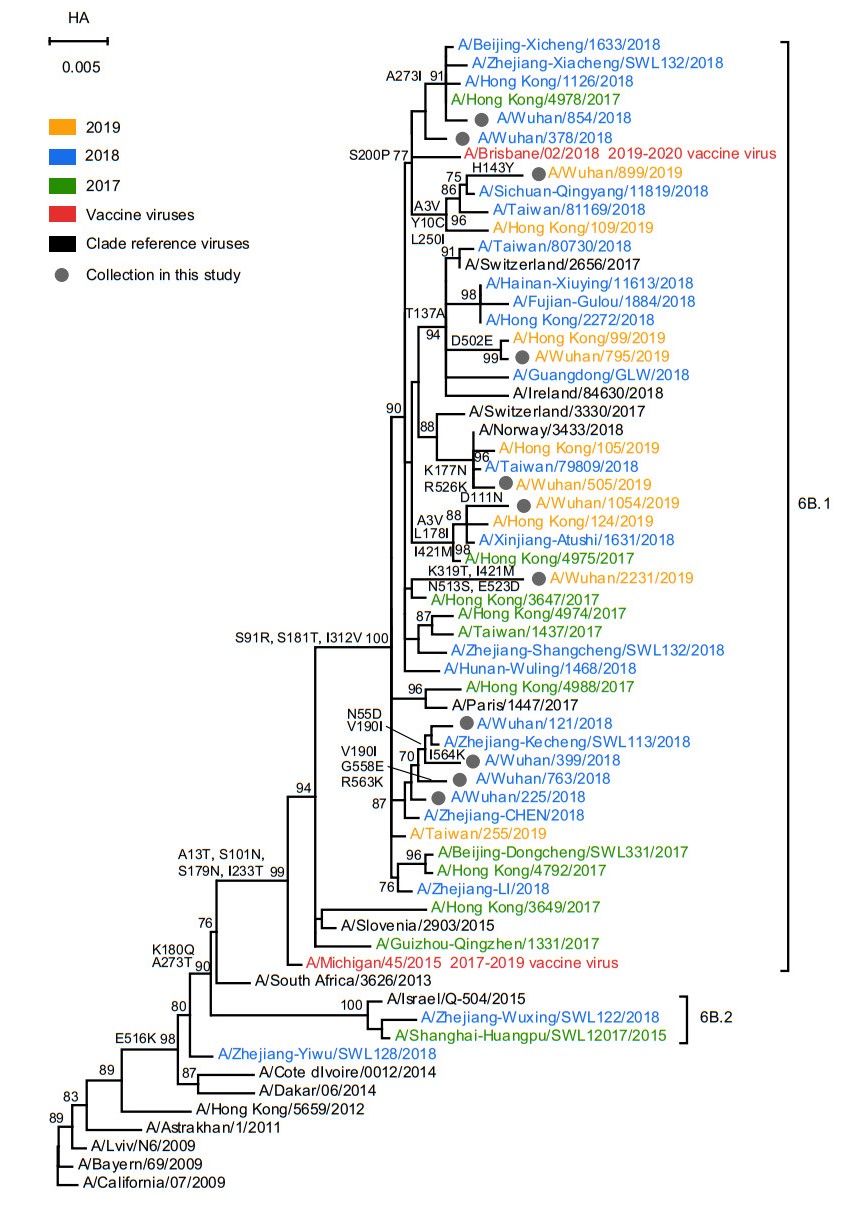
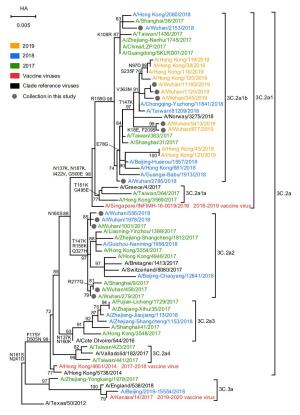
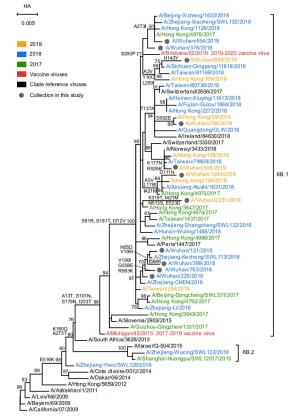
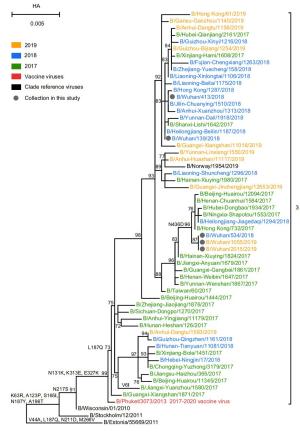
Type Year Clade No. of strain Vaccine strain % identity of HA Nucleotide Amino acid A/H3N2 2017 3c.2a2 3 A/Hong Kong/4801/2014 98.9–99.9 98.8–100 2018 3c.2a2, 3c.2a1b 4 A/Singapore/INFIMH-16-0019/2016 98.3–99.8 98.1–99.8 2019 3c.2a1b 5 A/Kansas/14/2017 96.3–100 96.5–99.9 A/H1N1 2018 6b.1 6 A/Michigan/45/2015 98.4–99.7 98.9–99.8 2019 6b.1 5 A/Brisbane/02/2018 98.0–98.9 98.1–98.9 B/Yamagata 2018 3 3 B/Phuket/3073/2013 98.4–99.9 99.5–99.8 2019 3 2 B/Phuket/3073/2013 98.4–99.9 99.1–99.7 Table 2. Comparison of nucleotide and amino acid similarities between the vaccine and the circulating seasonal influenza strains in Wuhan city, Hubei province, China.
-
Year Vaccine strain No. of strain Dominant epitope Differing Residues pepitope Efficacy Vaccine efficacy (47%) Vaccine efficacy (100%) 2017 A/Hong Kong/4801/2014 3 A 131, 142 0.1053 0.2099 20.99 44.66 2018 A/Singapore/INFIMH-16-0019/2016 2 A 131, 142, 171 0.1579 0.0800 8.00 17.02 1 A 135, 142 0.1053 0.2099 20.99 44.66 1 A 135 0.0526 0.3401 34.01 72.34 2019 A/Kansas/14/2017 5 A 131, 138, 144 0.1579 0.0800 8.00 17.02 Table 3. Efficacy among the vaccine strains and number of mutations found on the dominant epitope of A(H3N2) isolated in Wuhan city, Hubei province, China.
-
Year Vaccine strain No. of strain Dominant epitope Differing Residues pepitope Efficacy Vaccine efficacy (53%) Vaccine efficacy (100%) 2018 A/Michigan/45/ 2015 2 C 38, 295 0.0606 0.4579 45.79 86.40 2 B 183 0.0455 0.4759 47.59 89.79 1 C 295 0.0303 0.4939 49.39 93.19 1 D 164, 173 0.0417 0.4804 48.04 90.64 2019 A/Brisbane/02/ 2018 3 C 45, 298 0.0606 0.4579 45.79 86.40 1 C 45, 298, 302 0.0909 0.4218 42.18 79.59 1 B 160, 185 0.0909 0.4218 42.18 79.59 Table 4. Efficacy among the vaccine strains and number of mutations found on the dominant epitope of A(H1N1)pdm09 isolated in Wuhan city, Hubei province, China.
Figure 6 个
Table 4 个