-

-
-
-
-
-
-
Name Accession number Sample types No. of positive samples/no. of test samples (% positive) Detected coronaviruses Apodemus peninsulae CoV MT430884 Rats 3/50 (6.0) Betacoronavirus MtCoV N MT215336 Birds 4/25 (16.0) Deltacoronavirus MtCoV HM MT215337 Marmots 1/29 (3.4) Deltacoronavirus Table 1. Prevalence of beta- and delta-CoV in animal samples collected in Qinghai-Tibetan Plateau in July 2019.
-
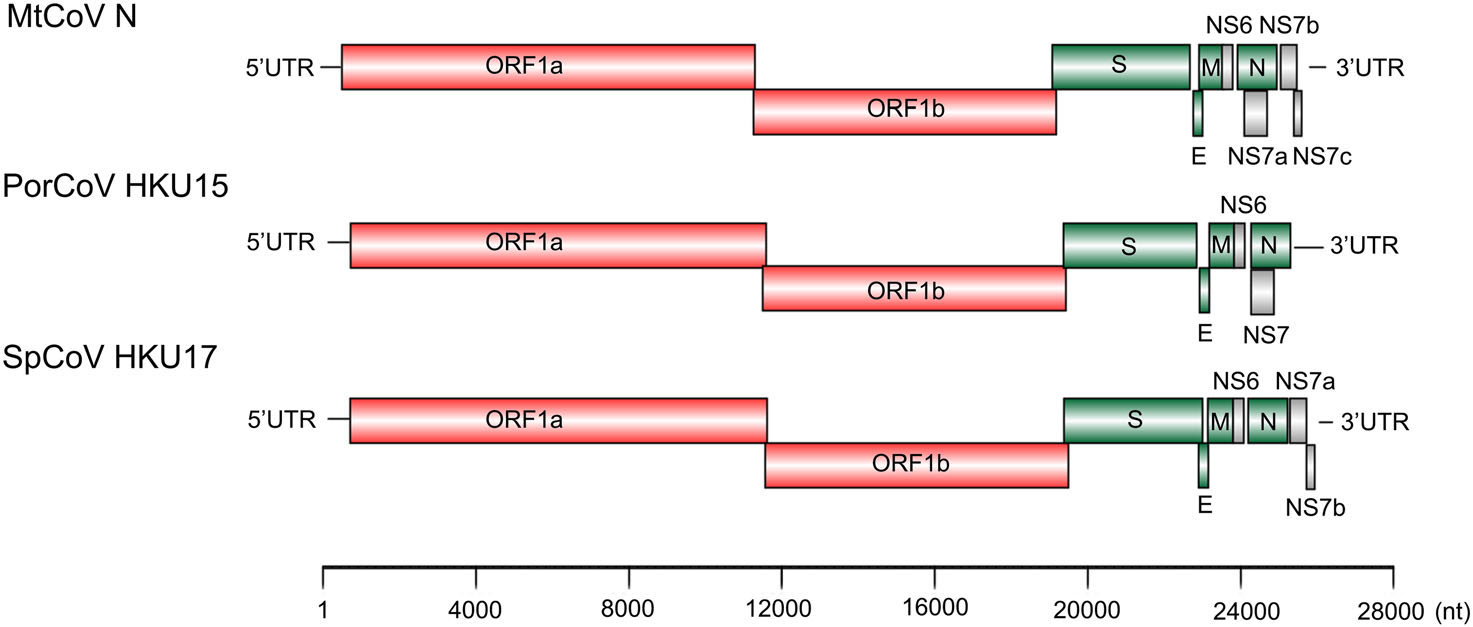
MtCoV Location (nt) Length (aa) Frame(s) TRS location TRS sequence distance bases to AUG ORF1ab 497–19, 227 6, 242 +2, +1 37 ACACCA(453)AUG S 19, 209–22, 808 1, 199 +3 19, 062 ACACCA(140)AUG E 22, 802–23, 053 83 +2 22, 775 ACCCCA(20)AUG M 23, 046–23, 699 217 +3 23, 019 ACACCA(20)AUG NS6 23, 699–23, 980 93 +2 23, 646 ACACCA(46)AUG N 24, 005–25, 033 342 +2 23, 991 ACACCA(7)AUG NS7a 24, 099–24, 695 198 +3 23, 991 ACACCA(101)AUG NS7b 25, 044–25, 472 142 +3 25, 033 ACACCA(4)AUG NS7c 25, 394–25, 588 64 +2 25, 348 ACACGA(39)AUG Table 2. Potential codings and predicted transcription regulatory sequences of the genome of MtCoV.
-
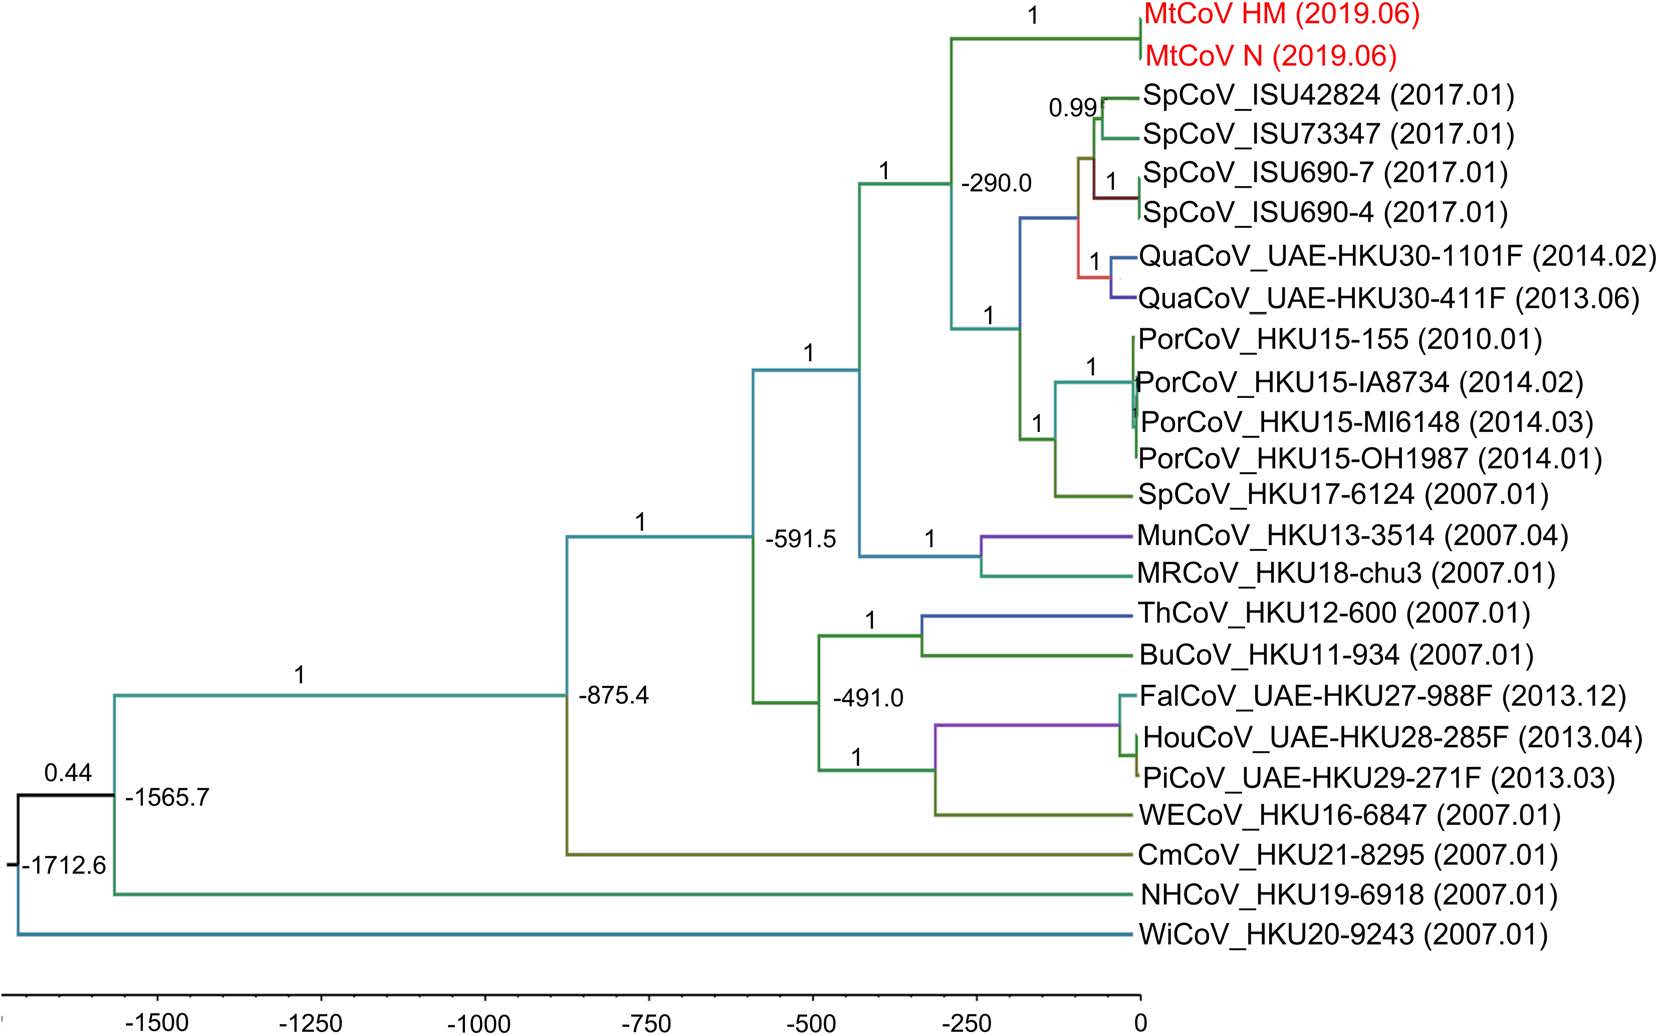
Domain SpCoV HKU17 PorCoV HKU15 SpCoV ISU690-4 QuaCoV UAE-HKU30 Amino acid identity (%) MtCoV ADRP 94.5 95.3 93.8 89.8 3CLpro 90.8 88.6 91.5 89.9 RdRp 95.0 94.9 94.7 93.2 Hel 97.8 97.3 97.7 97.5 ExoN 95.9 94.8 95.4 94.6 NendoU 90.5 88.4 89.6 89.9 O-MT 91.4 90.3 92.5 92.8 Concatenated 94.5 93.7 94.3 93.4 S 73.1 44.8 45.3 45.4 E 84.3 83.1 83.1 83.1 M 87.1 87.1 86.6 87.1 N 90.4 88.9 89.8 88.6 Table 3. Comparison of amino acid identities between MtCoV and closely related CoVs.
Figure 6 个
Table 3 个