-
-
-
-

-
Mild/moderate cases Severe/critical cases P Total 56 (63.64%) 32 (36.36%) Gender 0.136 Male 24 (42.86%) 19 (59.38%) Female 32 (57.14%) 13 (40.62%) Age (mean ± SD, years) 57.05 ± 13.94 55.34 ± 12.89 0.571 Sample collecting time (days)a 0.003 Median 12 9 Interquartile range 9–18 5–12 Nucleic acid test 0.748 Positive 42 (75.00%) 23 (71.88%) Negative 14 (25.00%) 9 (28.13%) Antibody tests IgM positive 24 (42.86%) 5 (15.63%) 0.009 IgM negative 32 (57.14%) 27 (84.37%) IgG positive 44 (78.57%) 14 (43.75%) 0.001 IgG negative 12 (21.43%) 18 (56.25%) aSampling time: the time interval between symptom onset and sample collection Table 1. Demographic information and test results of the studied subjects.
-
NAT resultsa Antibody test resultsa Total IgM IgG/IgM + IgG Positive Negative Positive Negative Positive 20 (22.73%) 45 (51.14%) 39 (44.32%) 26 (29.55%) 65 (73.86%) Negative 9 (16.98%) 14 (15.91%) 19 (21.59%) 4 (4.54%) 23 (26.14%) Total 29 (32.95%) 59 (67.05%) 58 (65.91%) 30 (34.09%) 88 (100%) aCombination of NAT and antibody test had significantly higher detection rate than single NAT (χ2 = 15.793, P < 0.001) or serologic test (χ2 = 24.643, P < 0.001). Table 2. Comparison of results of serum SARS-CoV-2 antibody tests and nucleic acid test (NAT).
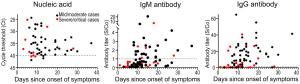
Figure 4 个
Table 2 个