-
-
-
-
-
-
-
-
-
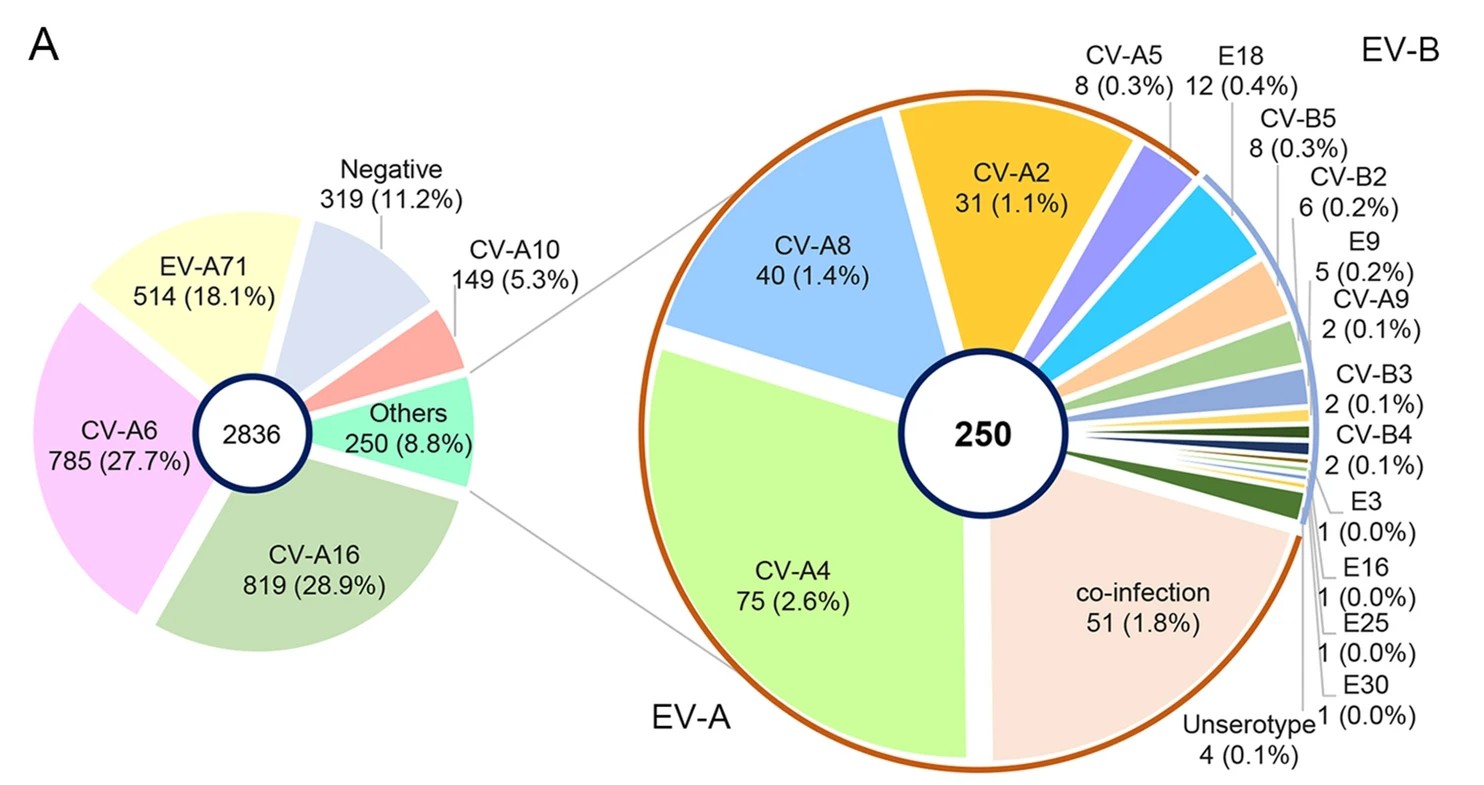
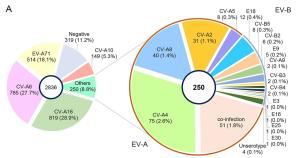
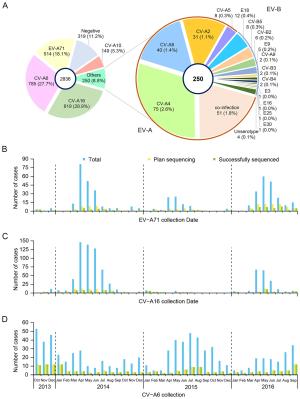
Serotype Region Total samples in study, N No. for VP1 sequencing, n1 (n1/N, %) No. successfully sequenced, n2 (n2/n1, %) After removing sequences that were < 1% divergent, n3 (n3/n2, %) EV-A71 > 90% complete in the VP1 region 514 144 (28) 72 (50) 24 (33) CVA16 > 90% complete in the VP1 region 819 136 (17) 103 (76) 43 (42) CVA6 > 90% complete in the VP1 region 785 181 (23) 176 (97) 65 (37) CVA10 Partial VP1 149 119 (80) 119 (100) 66 (55) CVA2 Partial VP1 31 16 (52) 16 (100) 11 (69) CVA4 Partial VP1 75 55 (73) 55 (100) 29 (53) CVA5 Partial VP1 8 7 (88) 7 (100) 6 (86) CVA8 Partial VP1 40 38 (95) 38 (100) 28 (74) CVB2 Partial VP1 6 6 (100) 6 (100) 5 (83) CVB5 Partial VP1 8 8 (100) 8 (100) 8 (100) E18 Partial VP1 12 10 (83) 10 (100) 8 (80) Table 1. The Pretreatments of VP1 sequences obtained in this study.
-
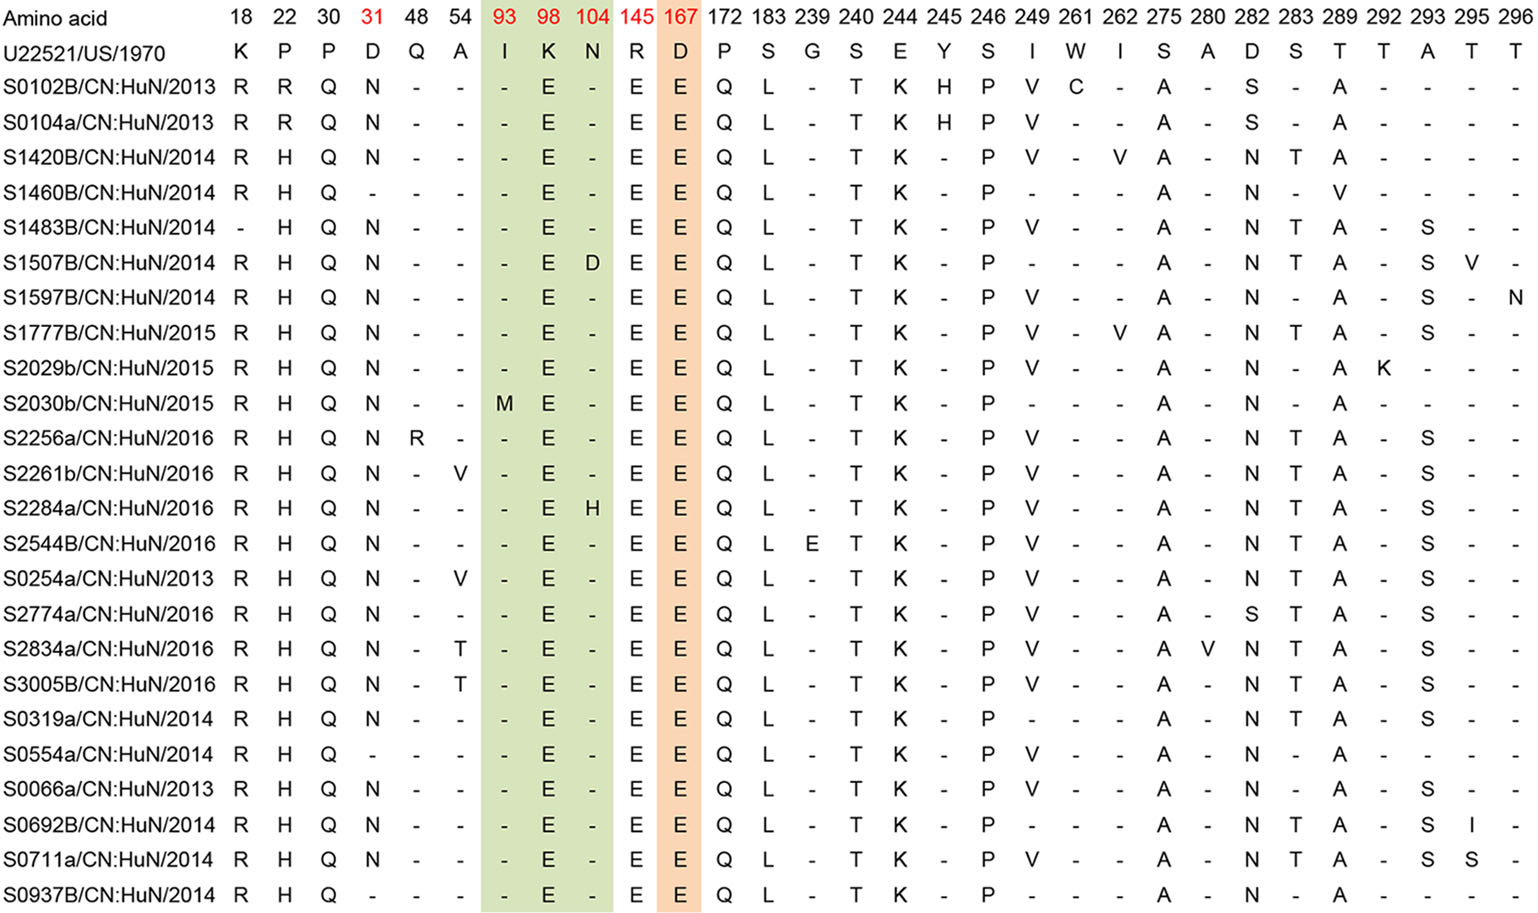
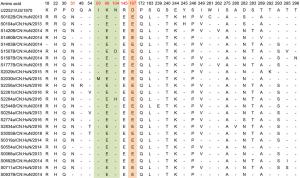
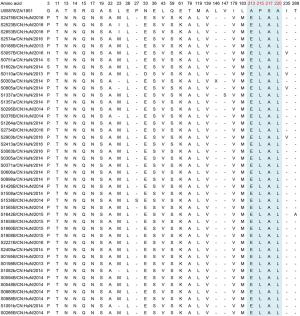
Site Anhua study n (N, %) Le et al. (2019) n (N, %)Zhu et al. (2013) n (N, %)Liu et al. (2014) n (N, %)van der Sanden et al. (2010) n (N, %)Chia et al. (2014) n (N, %)31 (D31N) 21 (24, 87.5%) 42 (43, 97.7%) 14 (14, 100%) – – 15 (16, 93.8%) 104 (N104D/H) 2 (24, 8.3%) – – 0 (49, 0%) – – 145 (R145E/G/Q) 24 (24, 100%) 43 (43, 100%) 14 (14, 100%) 49 (49, 100%) – 16 (16, 100%) 239 (G239E) 1 (24, 4%) – – – 0 (50, 0%) – 244 (E244K) 24 (24, 100%) 43 (43, 100%) 14 (14, 100%) – 50 (50, 100%) – 283 (S283T) 15 (24, 62.5%) 2 (43, 4.7%) – – – – 293 (A293S/G) 16 (24, 66.7%) 4 (43, 9.3%) – – 0 (50, 0%) – "–" Indicates not reported.
aEV-A71 prototype strain (genotype A, BrCr type-strain).Table 2. Variations detected in VP1 amino acid sequences of EV-A71 strains (compared with U22521/US/1970a).
-
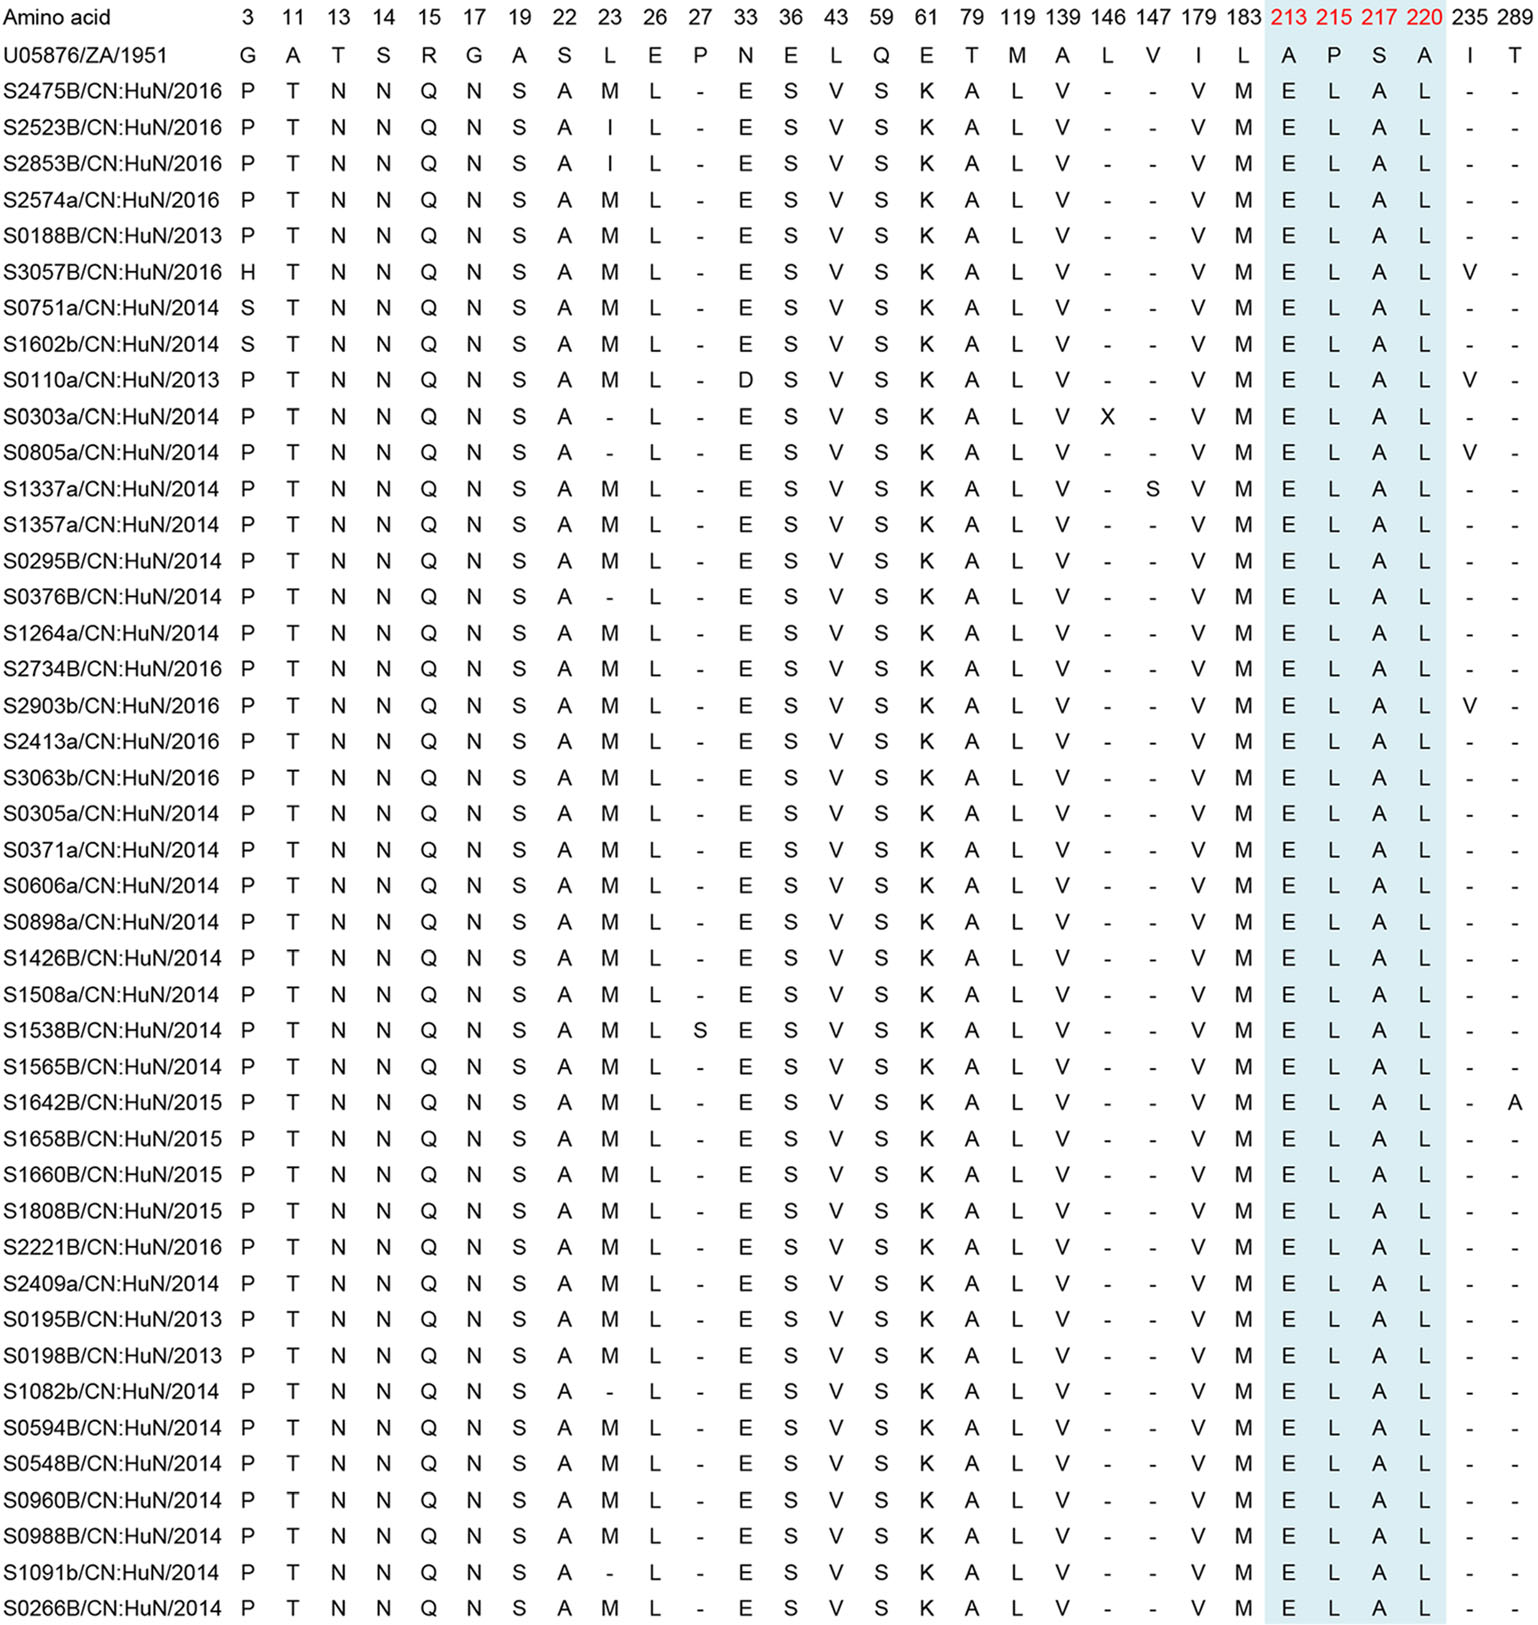
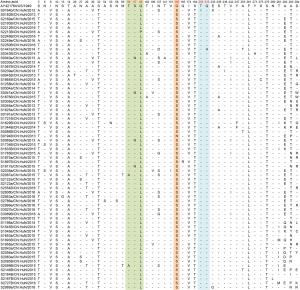
Site Anhua study n (N, %) Xu et al. (2018) n (N, %)Chan et al. (2012) n (N, %)Iwai et al. (2009) n (N, %)Sun et al. (2017) n (N, %)23 (L23I/M/V) 38 (43, 88.4%) 15 (146, 10.3%) – – 21 (35, 60%) 27 (P27S) 1 (43, 2.3%) – – – 0 (35, 0%) 146 (L146X) 1 (43, 2.3%) – – – 0 (35, 0%) 147 (V147S) 1 (43, 2.3%) – – – 0 (35, 0%) 235 (I235V) 4 (43, 9.3%) 5 (146, 3.4%) 1 (4, 25%) 1 (7, 14.3%) – 289 (T289A) 1 (43, 2.3%) – – 1 (7, 14.3%) 1 (35, 0%) "–" Indicates not reported.
aCVA16 prototype strain (genotype A, G10 type-strain).Table 3. Variations detected in VP1 amino acid sequences of CVA16 strains (compared with U05876/ZA/1951a).
-
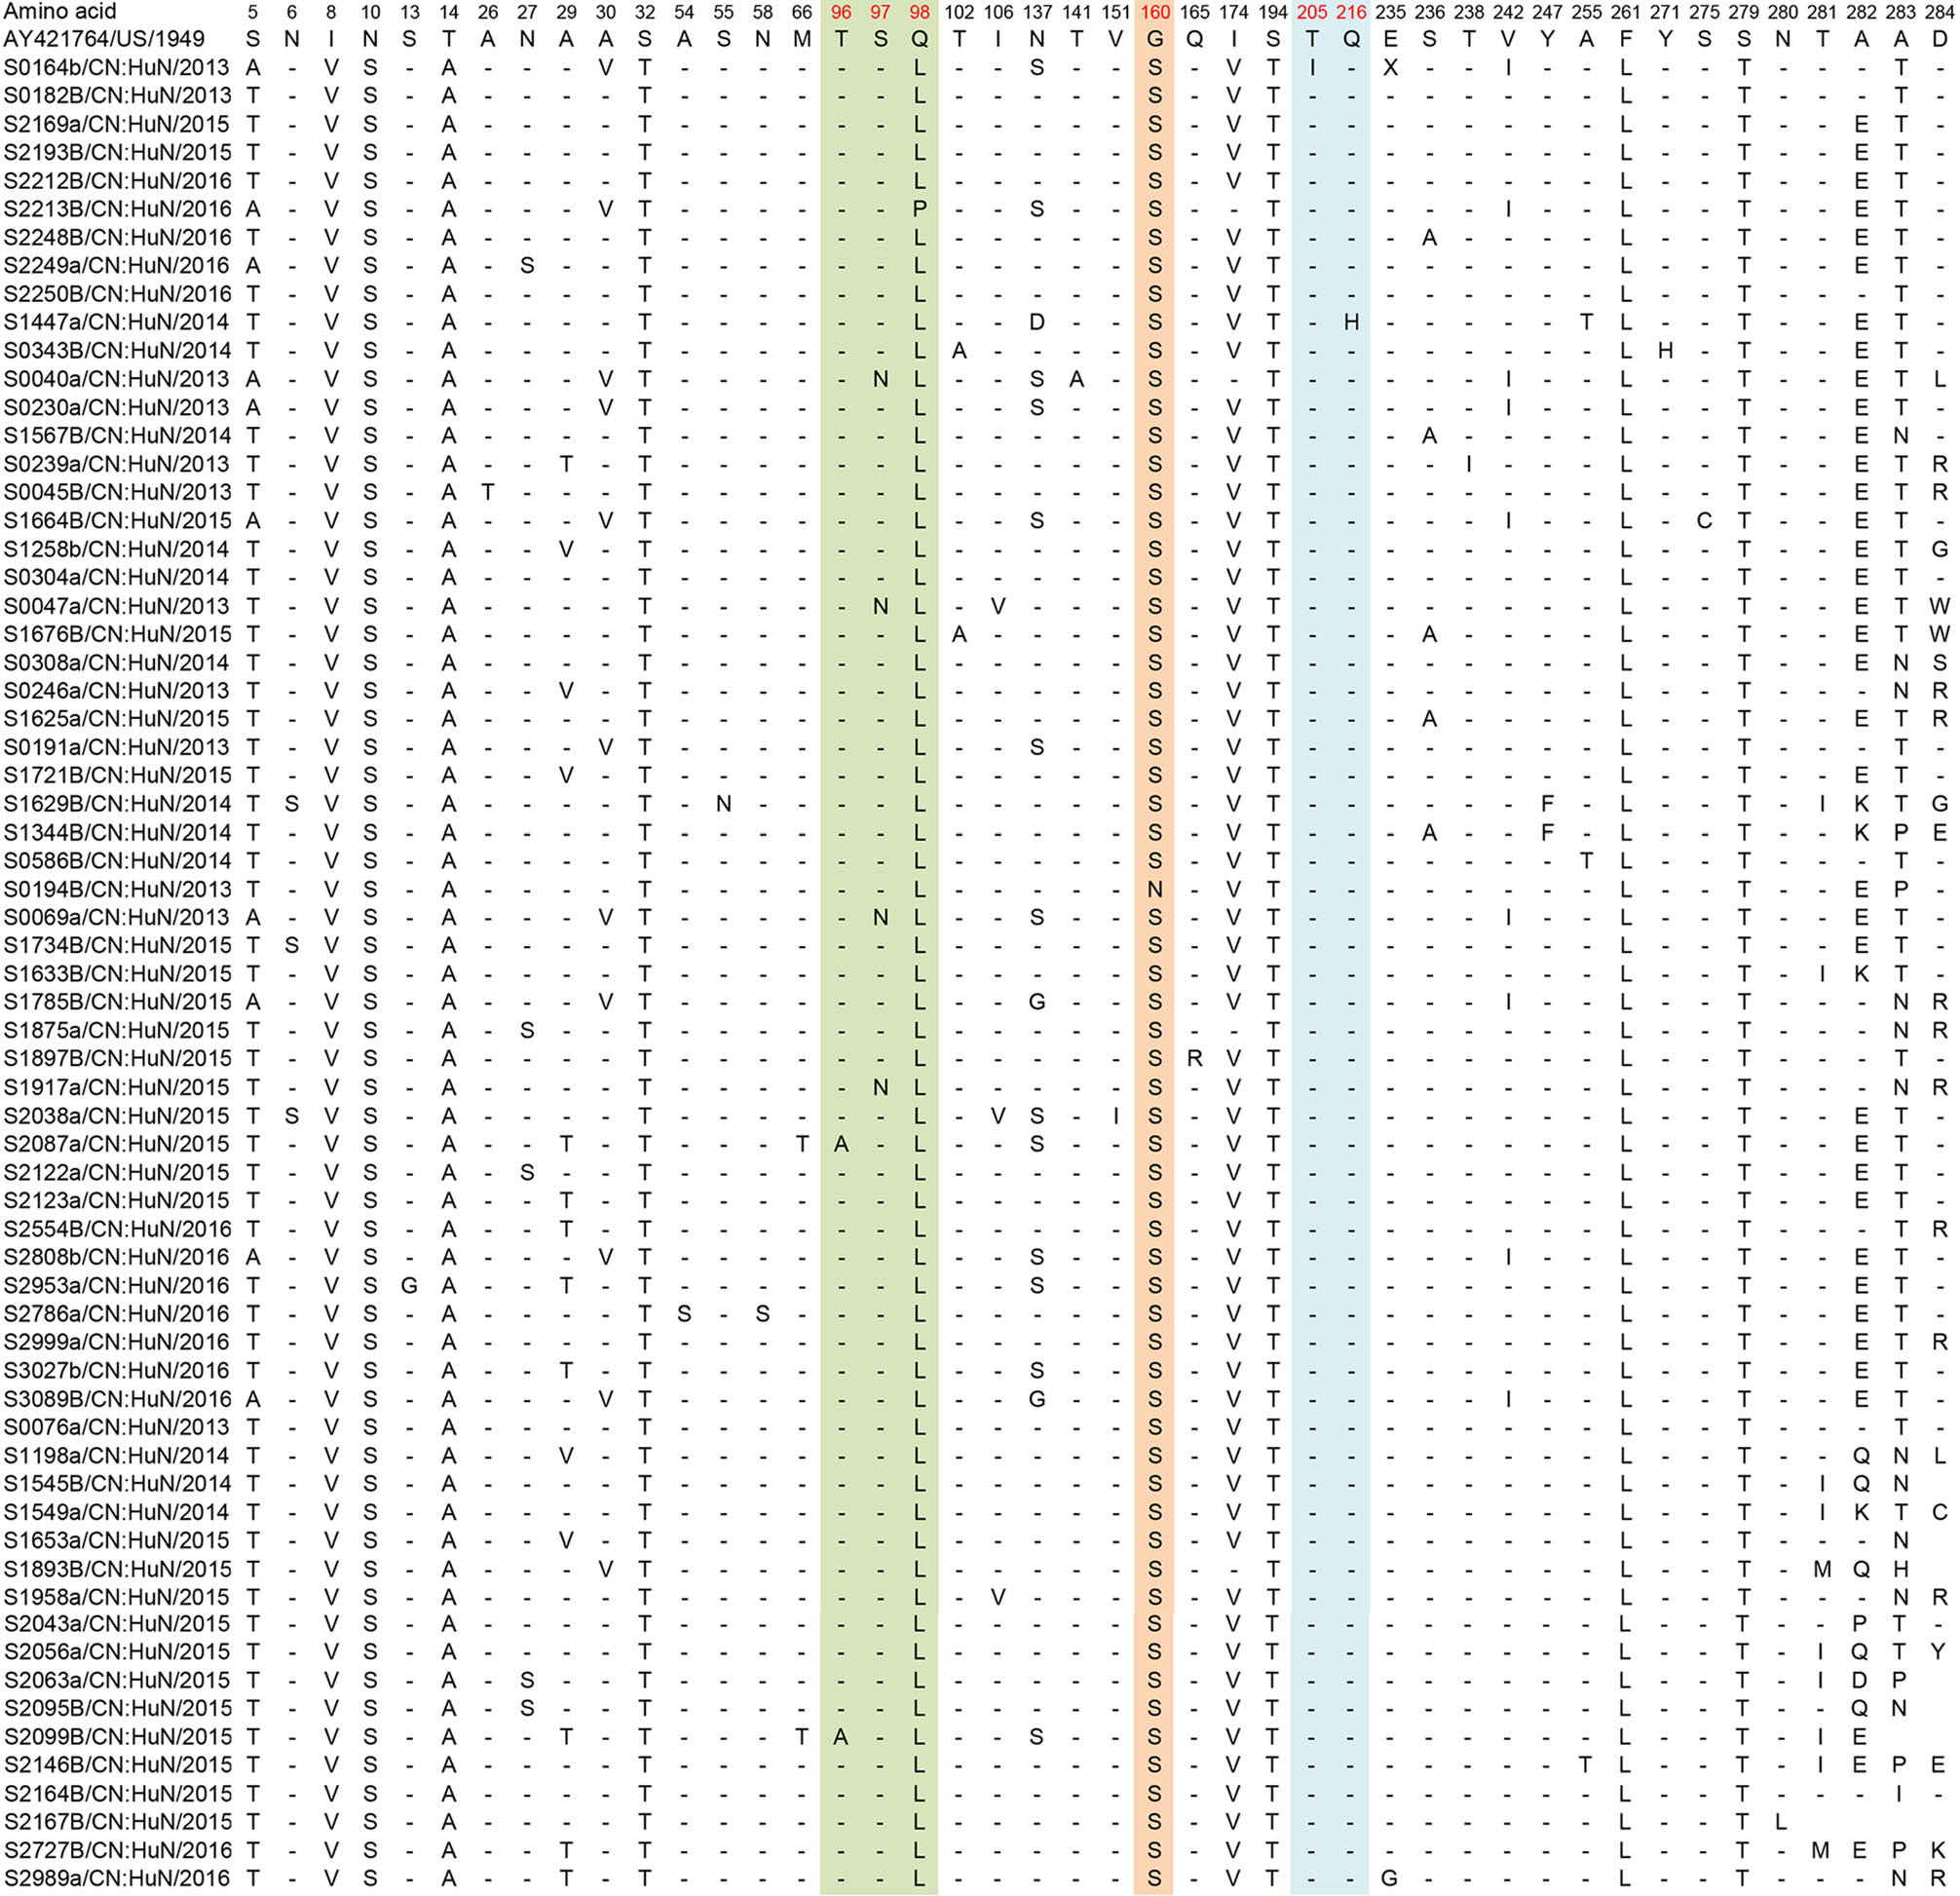
Site Anhua study n (N, %) Kanbayashi et al. (2017) n (N, %)96 (T96A) 2 (65, 3.1%) 0 (25, 0%) 97 (S97N) 4 (65, 6.1%) 0 (25, 0%) 137 (N137S/G/D) 16 (65, 24.6%) 14 (25, 56%) 141 (T141A) 1 (65, 1.5%) 0 (25, 0%) 151 (V151I) 1 (65, 1.5%) 0 (25, 0%) 160 (G160N/S) 65 (65, 100%) 17 (25, 68%) 165 (Q165R) 1 (65, 1.5%) 0 (25, 0%) 205 (T205I) 1 (65, 1.5%) 0 (25, 0%) 216 (Q216H) 1 (65, 1.5%) 0 (25, 0%) aCVA6 prototype strain (genotype A, Gdula type-strain). Table 4. Variations detected in VP1 amino acid sequences of CVA6 strains (compared with AY421764/US/1949a).
Figure 8 个
Table 4 个