-
-
-
-
-
-
-
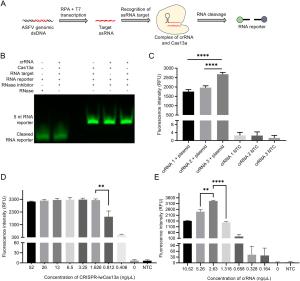
Isolate name GenBank no Country Genotype Mismatches cr1a cr2b cr3c E75 FN557520.1 Spain Ⅰ 0 0 0 Georgia 2007/1 NC_044959.1 Georgia Ⅱ 0 0 0 Wuhan 2019–1 MN393476.1 China Ⅱ 0 0 0 Krasnodar 2012 KJ195685.1 Russia Ⅱ 0 0 0 Pig/HLJ/2018 MK333180.1 China Ⅱ 0 0 0 Warmbaths AY261365.1 South Africa Ⅰ/Ⅲ 0 0 0 Warthog AY261366.1 Namibia Ⅳ 0 0 0 Tengani 62 AY261364.1 Malawi Ⅴ 0 0 0 Mkuzi 1979 AY261362.1 South Africa Ⅰ/Ⅶ 0 0 2 Ken06.Bus NC_044946.1 Kenya Ⅸ 2 0 2 Ken05/Tk1 KM111294.1 Kenya Ⅹ 2 0 2 Pretoriuskop/96/4 AY261363.1 South Africa ⅩⅩ/Ⅰ 0 0 0 a, b, c crRNA-1, crRNA-2 and crRNA-3, respectively Table 1. Analysis of mismatches on crRNA targeted regions of P72 genes from different genotype strains.
-
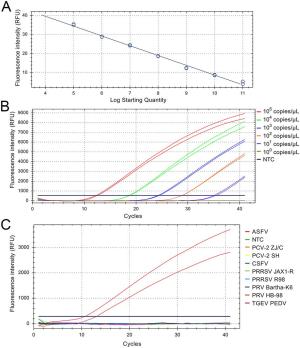
Plasmid concentration (copies/μL) Ct value sample 1 Ct value sample 2 Ct value sample 3 Standard deviation(SD) Variation coefficient(CV) 5 × 10⁷ 12.11 12.20 12.21 0.055 0.45% 5 × 10⁶ 15.36 15.40 15.46 0.050 0.32% 5 × 10⁵ 18.57 18.57 18.65 0.046 0.24% Table 2. Intra-assay variation coefficient of qPCR.
-
Plasmid concentration (copies/μL) Ct value sample 1 Ct value sample 2 Ct value sample 3 Standard deviation(SD) Variation coefficient(CV) 5 × 10⁷ 12.09 12.47 12.75 0.331 2.66% 5 × 10⁶ 15.36 15.58 16.26 0.469 2.98% 5 × 10⁵ 18.73 19.21 19.26 0.296 1.53% Table 3. Inter-assay variation coefficient of qPCR.
Figure 6 个
Table 3 个