-

-

-

Table 1. Distribution of the detected serums and controls in NIID RFFIT system in 96 well plate
-

Table 2. Detection results for the samples using NIID RFFIT and CCDC RFFIT
-

Table 3. T-test results for titers detected from NIID RFFIT and CCDC RFFIT
-

Table 4. T-test results for comparison of titers obained by operators P and M
-

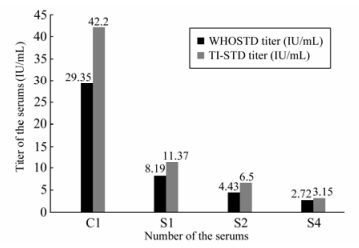
Table 5. T-test results for comparison of the detection results obtained from TI-STD, WHO STD with the original titer of the detected samples
Figure 2 个
Table 5 个