-
-
-

Table 1. Sample information and positive rates in different provinces or municipalities.
-

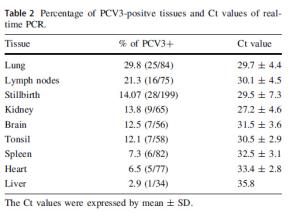
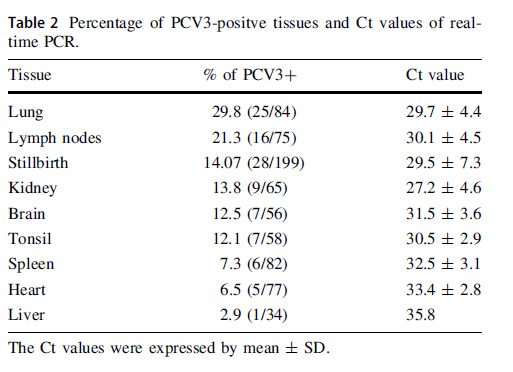
Table 2. Percentage of PCV3-positve tissues and Ct values of realtime PCR.
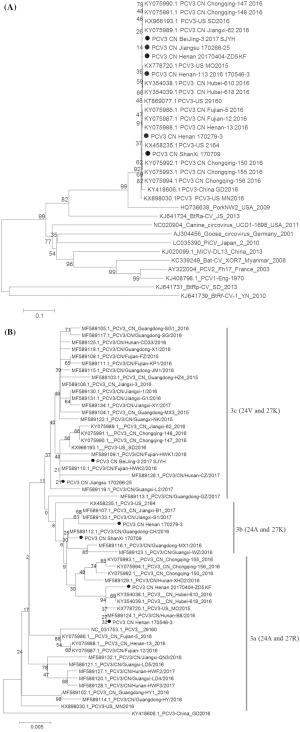
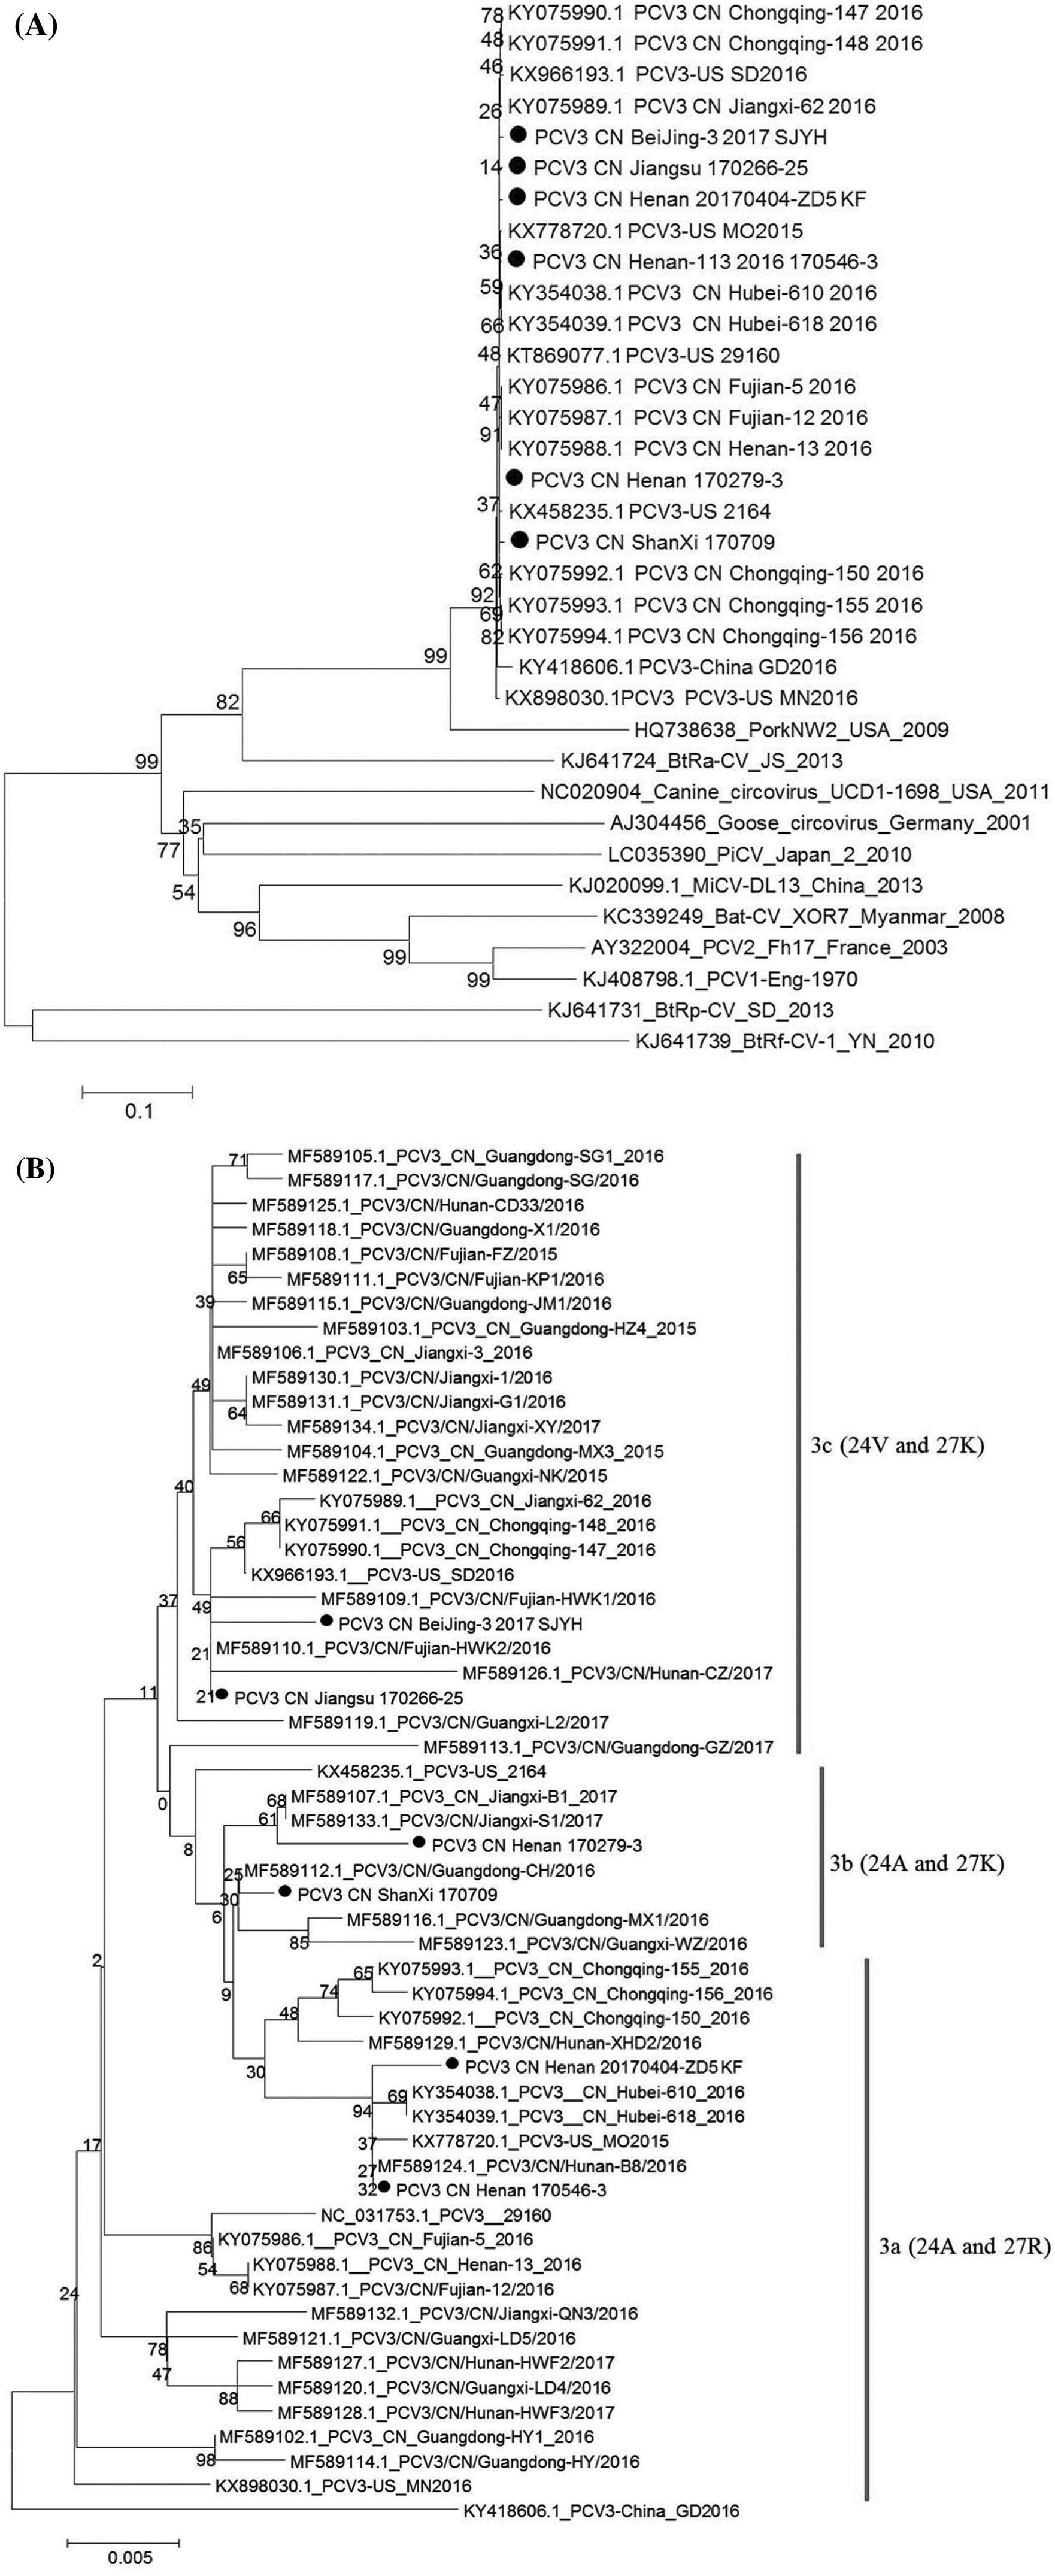
Figure 2 个
Table 2 个
|
|
Table 1. Sample information and positive rates in different provinces or municipalities.
|
|
Table 2. Percentage of PCV3-positve tissues and Ct values of realtime PCR.