-

-
Clinical data Variables Number (n = 57) Severe pneumonia (n = 29) (%) χ2 P values n % General information Sex Male 39 19 48.7 0.230 0.631 Female 18 10 55.6 Age, years > 2 31 12 38.7 4.026 0.045 ≤ 2 26 17 65.4 Clinical manifestations High fever Yes 57 29 50.9 NA NA No 0 0 Breathing Yes 13 9 69.2 2.270 0.132 No 44 20 45.5 Laboratory findings Leukocytosis Yes 30 18 54.5 1.133 0.287 No 27 11 40.7 Elevated hsCRP Yes 31 20 64.5 5.058 0.025 No 26 9 34.6 Elevated PCT Yes 33 21 63.6 5.105 0.024 No 24 8 33.3 Radiological findings Multifocal infiltrates Yes 35 20 57.1 1.424 0.233 No 22 9 40.9 Atelectasis Yes 11 9 81.8 5.221 0.022 No 46 20 43.5 Pleural effusion Yes 12 7 58.3 0.066 0.798 No 45 22 48.9 Underlying disease Yes 5 3 60.0 0.183 0.669 No 52 26 50.0 Complications Yes 15 11 73.3 4.108 0.043 No 42 18 42.9 CRP, C-reactive protein; PCT, procalcitonin. Table 1. Clinical analysis of all adenovirus pneumonia cases.
-
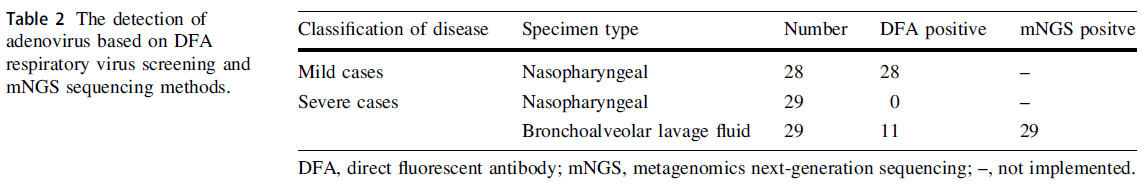
Classification of disease Specimen type Number DFA positive mNGS positve Mild cases Nasopharyngeal 28 28 – Severe cases Nasopharyngeal 29 0 – Bronchoalveolar lavage fluid 29 11 29 DFA, direct fluorescent antibody; mNGS, metagenomics next-generation sequencing; –, not implemented. Table 2. The detection of adenovirus based on DFA respiratory virus screening and mNGS sequencing methods.
-
Variables Total (n = 29) PB (n = 9) Non-PB (n = 20) P values Clinical features Fever days at admission 7 (2, 22) 6 (5, 9) 7 (2, 22) 0.9 Duration for fever after admission, days 6 (0, 21) 4 (2, 7) 8 (0, 21) 0.03 Total febrile days 12 (8, 30) 10 (9, 13) 15 (8, 30) 0.04 Hospitalization days 11 (5, 45) 9 (7, 12) 13 (5, 45) 0.01 Radiological findings Pleural effusion 7 (24.1%) 5 (55.6%) 2 (10.0%) 0.01 Atelectasis 9 (31.0%) 7 (77.8%) 2 (10.0%) 0.00 Multifocal infiltrates 20 (69.0%) 4 (44.4%) 16(80.0%) 1.0 Data are presented as median (interquartile range) and n (%). Table 3. Clinical and imaging characteristics of PB and non-PB in 29 severe adenovirus pneumonia cases.
Figure 1 个
Table 3 个