-

-
Number* Strain Sero-type Infec-tivity Inhibition zone to drugs (mm) Cepha-zolin Strepto-mycin Amika-cin Genta-mycin Ciproflox-acin Norflox-acin Tobra-mycin Erythro-mycin 1 HL041025A O24 Na 7 13 22 15 7 - - - 2 CH041025A O15 N - 12 8 12 16 14 9 7 3 ZC041025A O78 N 22 12 30 26 13 14 16 - 4 H041027A O88 Cb 18 - 22 20 8 - 18 11 5 C041027B X C - 7 19 25 8 7 15 7 6 EC041029A O78 C 24 7 24 26 14 7 30 - 7 EH041029B O78 N 21 10 25 30 10 7 24 - 8 C041029A O78 C 22 - 24 24 15 10 25 - 9 H041029 O78 N 24 - 26 22 17 11 20 10 10 L041030A O78 N 23 8 27 - 15 8 21 - 11 Z041030B O1 N 26 - 26 26 14 12 21 - 12 EZ041122A O73 N - 12 24 17 -8 8 14 - 13 EZ041030B O78 N 22 20 27 24 - 8 22 - 14 L041030B O78 N 18 15 23 28 13 - 22 - 15 L041030C O78 N 20 - 20 - 14 14 17 - 16 H041103A O23 N 16 13 18 19 - - 20 - 17 H041103D O88 N 13 8 23 8 7 - 17 - 18 H041104A O24 N 23 - 21 - 9 - 13 - 19 Z041108E O15 C 24 11 7 - - - - 10 20 EH041110D X C 22 10 26 - 17 - 18 8 21 ER041118B X C - - 25 10 12 - 17 - 22 G041126A O93 N 22 12 20 15 11 13 13 - 23 ER041118C X C 17 - 22 18 11 9 15 - 24 ER041118B X N 19 14 19 19 13 11 17 - 25 BL21 / N U U U U U U U U 26 JM109 / N U U U U U U U U 27 JM110 / N U U U U U U U U 28 DH5α / C U U U U U U U U Note: * Strains that numbered 1-24 were isolated from diseased chicken organs and identified as E. coli in 2004 and were multi-resistant to antibiotics at different levels. Strains that numbered 25–28 are laboratory E. coli strains used widely in gene engineering operation. -: no Inhibition zone to the drug. U: drug sensitivety test on these strains was not done; Na: no lysis; Cb: clear lysis. Table 1. E. coli strains used for determination of vB_EcoP-Bp4 host range in this study
-
ORF Start Stop Size(bp) Hypothetical protein Molecular
mass (kDa)No. of
amino acidsIdentities (%) KBNP21 IME11 pSb-1 EC1-UPM vB_EcoP-G7C N4 phAPEC5 1 2 268 267 hypothetical protein 9.65 89 100 96.6 90.4 97.8 94.4 82 - 2 470 796 327 hypothetical protein 12.71 109 93.9 72.7 59.1 56.8 - - 68.7 3 793 948 156 hypothetical protein 6.17 52 96.1 - - - - - 96.1 4 1076 1249 174 hypothetical protein 6.26 58 90.9 - 87.3 85.5 80.8 - 90.7 5 1396 1698 303 hypothetical protein 11.6 101 86 82 86.9 88 89 - 85 6 1685 2074 390 hypothetical protein 15.05 130 93.9 90.8 88.5 84.6 90 - 90.8 7 2274 2564 291 hypothetical protein 11.17 97 91.7 93.5 97.8 96.7 91.3 54.1 91.3 8 2734 3423 690 hypothetical protein 25.62 230 100 100 100 - 99.1 78 99.6 9 3416 5005 1590 terminase subunit A 60.77 530 100 99.6 99.8 99.8 99.6 92.3 99.6 10 5012 5722 711 putative tail protein 27.04 237 100 74.4 100 99.6 100 69.9 99.6 11 5713 7515 1803 tail fiber protein 64.65 601 75.3 57.1 79.1 93.4 85.9 - 90.5 12 7521 8435 915 hypothetical protein 31.9 305 - - - - - - - 13 8484 10598 2115 tail spike protein 74.33 705 98.7 - 86.4 98.3 63.3 - 86.5 14 10629 11282 654 hypothetical protein 23.52 218 96.7 - 95.2 - - - - 15 11380 11709 330 tail length tape-measure protein 12.43 110 99.1 89.1 98.2 96.8 87.9 83.9 87.1 16 11694 11954 261 putative holin protein 10.04 87 - 95.3 97.7 98.8 90.7 82.9 - 17 11944 12579 636 putative N-acetylmuramidase 22.82 212 99.5 98.4 100 - 97.8 85.2 98.4 18 12842 13066 225 putative Rz/Rzl spanin protein 8.61 75 100 98.6 - 100 98.6 88.9 98.6 19 13069 15339 2271 portal protein 85.18 757 99.7 98.7 99.5 99.7 98 85.8 98.8 20 15353 15697 345 hypothetical protein 12.83 115 100 96.5 - - 99.1 70.5 96.5 21 15717 16937 1221 tape measure protein 44.45 407 100 97 98.7 98.3 97.8 71.5 97 22 16954 18156 1203 major coat protein 44.13 401 100 99.3 99.3 100 99.8 94 99.5 23 18230 18865 636 hypothetical protein 23.65 212 99.5 98.1 99 98.6 97.6 75 96.2 24 18942 19778 837 putative structural protein 30.4 279 100 89.6 99.3 97.8 97.8 76.5 99.3 25 19780 20916 1137 hypothetical protein 41.78 379 98.4 98.4 98.9 99.2 96.5 66.6 98.4 26 21108 22433 1326 hypothetical protein 48.07 442 99.8 95.9 98.4 96.6 95.7 73.4 97.7 27 22447 22890 444 structural protein 15.63 148 98.6 98 97.6 88.6 82.4 68.7 98.6 28 22903 23769 867 structural protein 31.25 289 83.3 89.2 82.3 83 88.9 67.7 90 29 23766 24029 264 structural protein 9.52 88 81.5 97.5 81.5 81.5 100 86.4 97.5 30 24026 24862 837 structural protein 30.3 279 66.8 97.1 67.5 64.2 100 58.9 97.5 31 24956 35668 10713 virion RNA polymerase 389.53 3571 98.5 97.5 99.2 94.4 93.8 82.3 97.3 32 35703 36194 492 hypothetical protein 18.87 164 99.4 84.8 - - - 94.3 95.1 33 36313 36693 381 hypothetical protein 13.79 127 100 67.5 - 96.8 - 69.9 98.4 37083 37010 tRNA 37862 37787 tRNA 34 38611 38811 201 hypothetical protein 7.5 67 100 - 98.1 - 94.4 - - 35 39046 39486 441 hypothetical protein 15.92 147 100 97.9 95.9 95.9 94.5 - 94.5 36 39488 40042 555 hypothetical protein 20.03 185 100 98.9 99.5 - 98.9 81.9 99.5 37 40042 40845 804 ssDNA-binding protein 28.83 268 100 98.7 98.4 98.7 95.7 73.2 95.7 38 40885 41637 753 hypothetical protein 28.57 251 100 99.2 - 99.2 99.2 88.8 99.2 39 41694 43586 1893 DNA primase 72.36 631 98.7 98.6 - 98.6 98.3 88 98.1 40 43583 43726 144 DNA primase 4.76 48 93.5 93.5 93.5 93.5 93.5 93.5 93.5 41 43843 44823 981 hypothetical protein 37.65 327 100 98.5 98.6 99.4 97.5 82.4 97.5 42 44820 45317 498 HNH homing endonuclease 19.02 166 100 - - 96.9 99.4 - 63.3 43 45389 45865 477 hypothetical protein 18.5 159 100 72.6 98.7 98.7 80.8 89.3 82.6 44 45865 46170 306 hypothetical protein 11.6 102 100 100 100 100 98 73 98 45 46167 46661 495 DNA polymerase 18.61 165 100 99.4 99.4 100 100 92 100 46 46948 48633 1686 DNA polymerase - - 100 99.8 100 99.4 99.6 81.3 99.6 47 48753 49283 531 hypothetical protein 64.9 562 100 99.4 100 98.9 97.7 7108 96.6 48 49294 50604 1311 DNA helicase 19.95 177 100 99.3 99.3 99.5 99.3 81.9 99.3 49 50638 50976 339 hypothetical protein 48.93 437 100 99.1 80 79.8 76.4 98.5 69.9 50 51023 51418 396 hypothetical protein 12.1 113 100 100 99.1 97.7 95.4 87 96.2 51 51481 53529 2049 rllB-like protein 14.96 132 99.4 92.3 94 90.7 90.9 67.4 92.3 52 53534 53779 246 rllA-like protein 75.73 683 96.3 95.1 96.3 92.6 86.3 - 86.3 53 53881 55263 1383 rllA-like protein - - 98.5 93.9 93.9 96.1 90.4 54.3 92.4 54 55281 56099 819 rllA-like protein - - 97 97.7 95.8 97.3 95.4 75.8 94.7 55 56127 56318 192 hypothetical protein 29.86 273 100 - - - - - 100 56 56311 56637 327 hypothetical protein 7.23 64 100 98.1 99.1 89.9 87.4 75.9 88 57 56630 56842 213 hypothetical protein 11.54 109 100 100 100 100 97.1 62.2 70.7 58 56902 57117 216 hypothetical protein 7.85 71 100 88.7 65.7 98.6 65.7 - 65.7 59 57137 58081 945 thymidilate synthase 8.6 72 97.5 94.9 96.4 93.6 88.9 81.4 90.4 60 58081 58524 444 hypothetical protein 35.89 315 99.3 98 98.6 95.9 95.2 51.7 96.6 61 58524 58904 381 hypothetical protein 17.17 148 87.5 85.2 66.9 89.7 - 62.3 86.7 62 59060 59263 204 putative membrane immunity protein 14.88 127 96.9 96.9 98.5 100 98.4 - 98.4 63 59337 59546 210 hypothetical protein 7.52 68 95.7 91.3 67.2 - 66.7 - 53.8 64 59556 60062 507 dCTP deaminase 18.81 169 97.6 98.8 98.8 70 98.8 76.2 69.3 65 60062 60580 519 hypothetical protein 19.76 173 99.4 98.8 98.8 98.8 99.4 77.8 98.8 66 60635 61234 600 hypothetical protein 22.97 200 100 96.5 95.1 97.7 97.7 72 97.1 67 61234 61545 312 hypothetical protein 11.66 104 - - 60.4 - 74.8 - - 68 61720 61953 234 hypothetical protein 8.88 78 97.4 100 98.7 97.4 98.7 68.1 98.7 69 61965 62771 807 hypothetical protein - - 100 100 100 99.5 100 85.5 100 70 62806 63135 330 hypothetical protein 11.78 110 96.5 98.8 98.8 98.8 61 - 58.5 71 63136 63321 186 hypothetical protein 6.62 62 100 98.4 96.7 98.4 98.4 - 95.1 72 63318 63527 210 hypothetical protein 7.62 70 98.6 98.6 - 98.6 - - - 73 63524 63784 261 hypothetical protein 10.09 87 90.6 - - 90.7 - - - 74 63781 63969 189 hypothetical protein 6.91 63 100 - 65.6 98.4 98.4 - 93.5 75 64030 64290 261 hypothetical protein 8.93 87 - 95.3 - - - - - 76 64428 65261 834 capsid decorating protein 28.54 278 95.8 95.3 96.4 92.8 88.3 82.1 95.7 77 65335 65517 183 hypothetical protein 6.78 61 100 90 96.7 - 85.76 - 85.7 78 65575 66792 1218 RNAP2 45.9 406 100 99.5 100 99.5 93.6 81.2 93.8 79 66848 67009 162 hypothetical protein 6.19 54 98.1 100 - - - - 98.1 80 66999 67817 819 RNAP1 31.99 273 99.3 99.3 98.1 98.2 98.5 81 98.2 81 67871 68131 261 hypothetical protein 10.29 87 90.7 90.7 - 90.7 - - 96.5 82 68128 68511 384 hypothetical protein 14.04 128 66.1 67 67.8 67 67.8 82.5 96 83 68588 68692 105 hypothetical protein 3.98 35 - - - - - 100 93.3 84 68689 68832 144 hypothetical protein 5.39 48 - - - - - - 95.7 85 68930 69310 381 hypothetical protein 14.09 127 94.4 95.2 95.2 - 91.3 95 95 86 69307 69621 315 hypothetical protein 12.09 105 97.1 - 97.1 97.1 89.4 90.3 91.3 87 69618 69809 192 hypothetical protein 7.07 64 100 - - - - - - 88 69806 70063 258 hypothetical protein 9.77 86 100 94 95.2 91.7 76.2 - 77.4 89 70060 70281 222 hypothetical protein 8.71 74 100 91.8 91.8 93.2 94.5 - 97.3 90 70287 70517 231 hypothetical protein 8.67 77 100 - - - - - 88.2 91 70510 70818 309 hypothetical protein 11.44 103 99 96 96.1 96.1 95 82.4 - 92 70897 71025 129 hypothetical protein 4.94 43 100 59.6 92.9 90.5 90.5 66 62.1 93 71010 71192 183 hypothetical protein 7.25 61 100 77.2 98.3 98.3 96.4 - - 94 71189 71377 189 hypothetical protein 7.55 63 100 63.9 - 100 - - 61.3 95 71518 71898 381 RNAP1 subunit A 14.03 127 99.2 94.5 92.8 100 94.5 84.4 94.5 Table 2. Genome annotation of phage vB_EcoP-Bp4
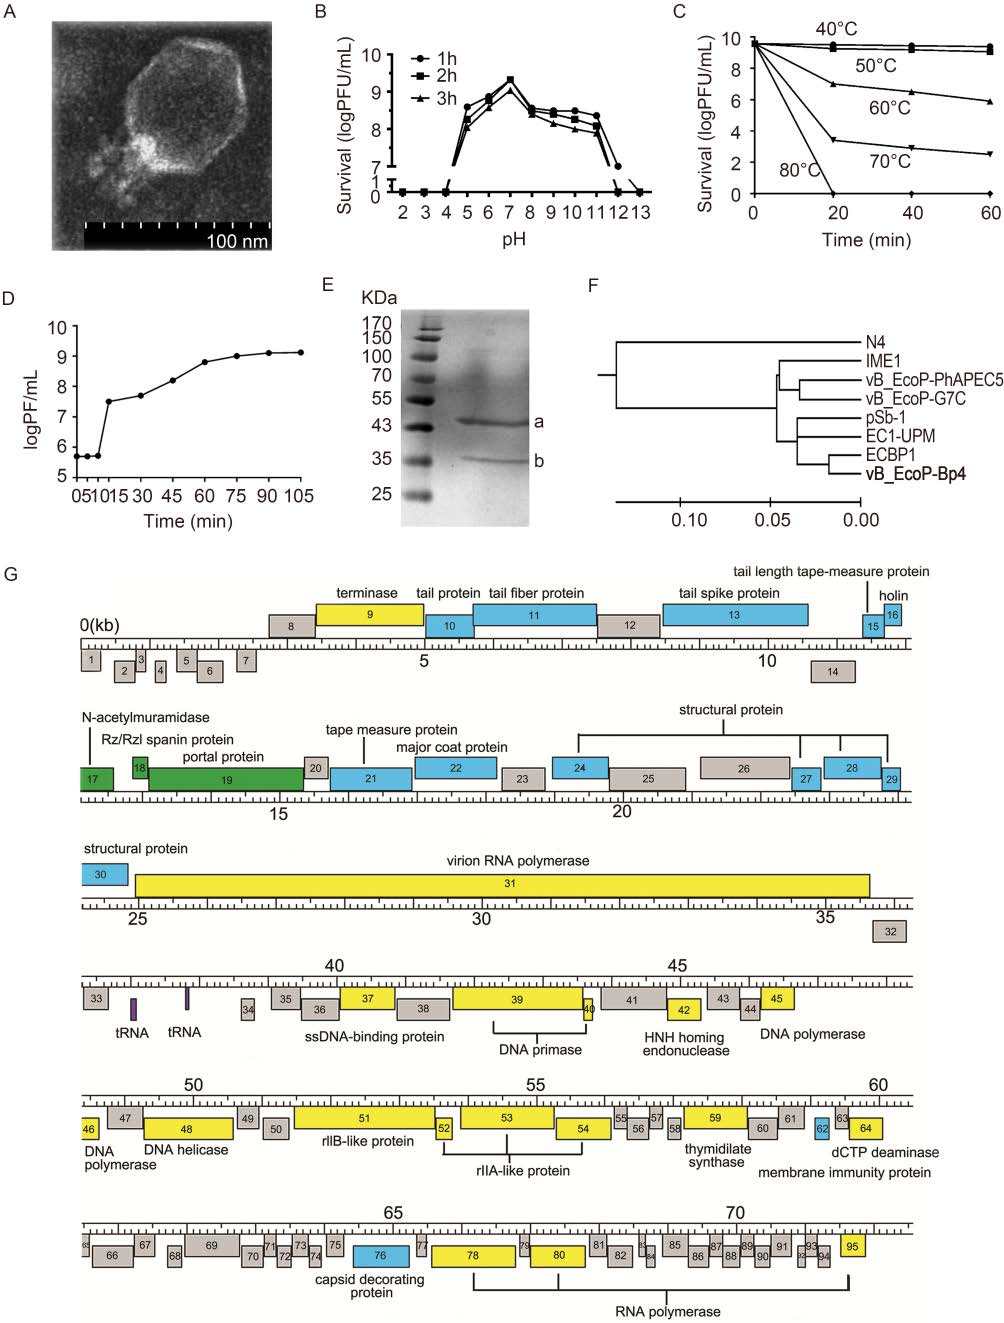
Figure 1 个
Table 2 个