-

-
Sampling date Temperature, ℃ Water-quality grades TLI Water-nutritiongrades Beyond Index 16 May 23 Ⅳ 56.42 Light eutrophication TP, COD, BOD5 14 June 30 Ⅳ 58.24 Light eutrophication TP, COD 16 July 29 Ⅴ 58.42 Light eutrophication TP, COD 30 August 28 Ⅴ 61.43 Moderate eutrophication TP, COD, CODMN 27 September 23 Ⅴ 59.91 Light eutrophication TP, COD, BOD5 11 October 22 Ⅳ 59.91 Light eutrophication TP, COD, BOD5, CODMN 14 November 15 Ⅳ 57.71 Light eutrophication TP, COD 24 December 5 Ⅳ 50.55 Light eutrophication TP 24 January 5 Ⅲ 46.71 Mesotrophication 25 February 10 Ⅲ 46.71 Mesotrophication 25 March 15 Ⅲ 47.71 Moderate eutrophication 26 April 20 Ⅲ 49.55 Moderate eutrophication *BOD5, biochemical oxygen demand; COD, chemical oxygen demand; CODMN, permanganate index; TLI, aggregative trophic level index; TP, total phosphorus. Table 1. Physical and chemical characteristics of water in different months, East Lake
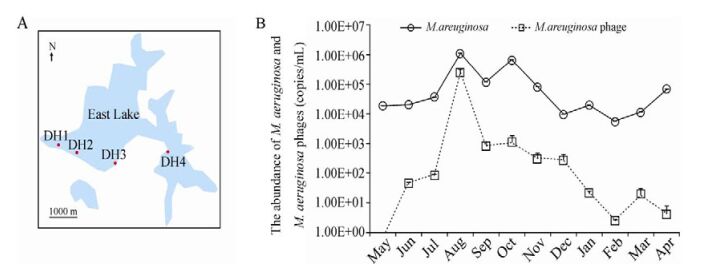
Figure 1 个
Table 1 个