-

-
-
ALT Alanine transaminase anti-HAV Antibody to hepatitis A virus anti-HBc Antibody to hepatitis B core antigen anti-HBe Antibody to hepatitis B e antigen anti-HBs Antibody to hepatitis B surface antigen anti-HCV Antibody to hepatitis C virus anti-HDV Antibody to hepatitis D virus anti-HEV Antibody to hepatitis E virus CA9 Carbonic anhydrase 9 CHB Chronic hepatitis B DNA Deoxyribonucleic acid DOCK8 Dedicator of cytokinesis 8 DP Double positive ELISA Enzyme-linked immunosorbent assay GWAS Genome wide association study HBeAg Hepatitis B e antigen HBsAg Hepatitis B surface antigen HBV Hepatitis B virus HBx Hepatitis B x protein HCC Hepatocellular carcinoma HDV Hepatitis D virus HEV Hepatitis E virus IgM Immunoglobulin M LLOD Lower limit of detection PCR Polymerase chain reaction SD Standard deviation SP Single positive TOF Time of flight mass spectrometry WES Whole exome sequencing -
Inclusion criteria Cases (DP, chronic HBV infection)
1. HBsAg, anti-HBc positive for at least 6 months and no history of hepatitis B vaccination
2. anti-HAV, anti-HEV, HDAg negative and /or anti-HDV negative
3. Anti-HCV negative, HCV RNA negative
4. For DP cases in the first stage, anti-HBs positive for at least 6 months; for chronic HBV infection cases in the second stage, anti-HBs can be positive or negativeControls (SP, HBV clearance)
1. Anti-HBs and anti-HBc positive or anti-HBs positive and no history of hepatitis B vaccination; HBsAg negative
2. HBV-DNA negative, anti-HAV, anti-HEV, HDAg negative and /or anti-HDV negative
3. Anti-HCV negative, HCV RNA negativeExclusion criteria* 1. Evidence of past or current infection by HCV or HDV
2. With other hepatitis virus infection
3. Other systemic disease not related to HBV infection
4. Age less than 18 for all cases and controls
5. Not of Han ethnicityDP: double positive; SP: single positive.
*Excluded from enrollment if one or more of the exclusion criteria were met, applicable for all the two stage samples.Table 1. Inclusion and exclusion criteria.
-
Group Cases (n=579) Controls (n=439) P value Age, y Mean (x ± SD) 49.57±14.74 (579) 61.93±13.40 (439) 0.000 Range 18-84 18-96 Male, %(n) 55% (317/579) 59% (261/439) 0.142 HBsAg positive, %(n) 100% (579) 0 (439) 0.000 anti-HBs positive, %(n) 6.8% (39/571) 100% (439) 0.000 HBeAg positive, %(n) 18% (103/565) 0 (0/439) 0.000 ALT, IU/mL, mean±SD (n) 32.74±60.06 (456) 21.88±23.86 (333) 0.000 HBV-DNA, log IU/mL, mean±SD (n) 1.63±2.51 (277) 0.00±0.00 (14) 0.000 P values less than 0.05 are indicated in bold
ALT Alanine transaminase; anti-HBs antibody to the hepatitis B surface antigen; DP double positive; HBeAg hepatitis B e antigen; HBsAg hepatitis B surface antigen; SD standard deviationTable 2. Characteristics of subjects in the second stage of time of flight mass spectrometry.
-
Position Case (n%) Control (n%) OR (95%CI) P value rs1048906 62.37 64.45 0.91 (0.76–1.10) (C/T)* 0.35 rs10821128 46.37 49.20 0.89 (0.75–1.06) (C/T) 0.21 rs11040923 67.00 62.4 1.22 (1.02–1.47) (A/G) 0.035 rs16932912 34.30 35.10 0.97 (0.80–1.16) (A/G) 0.74 rs17206365 70.80 71.60 0.96 (0.79–1.18) (A/T) 0.72 rs1870134 28.60 26.10 1.14 (0.93–1.39) (C/G) 0.21 rs2071676 52.60 46.70 1.27 (1.06–1.51) (A/G) 0.009 rs2073674 55.10 55.70 0.98 (0.82–1.16) (A/C) 0.79 rs2075688 100 100 - (C) - rs2272662 52.80 55.90 0.88 (0.74–1.05) (C/T) 0.19 rs2277603 77.90 81.30 0.81 (0.65–1.01) (A/G) 0.06 rs2288868 80.60 72.50 1.58 (1.28–1.94) (C/T) 2.28E-5 rs2297879 45.20 49.20 0.85 (0.71–1.01) (C/T) 0.07 rs2302061 29.70 29.00 1.03 (0.85–1.25) (C/T) 0.77 rs3732487 46.00 49.00 0.89 (0.75–1.06) (G/T) 0.19 rs3733662 28.70 31.40 0.88 (0.73–1.06) (A/C) 0.19 rs3745535 34.60 36.10 0.94 (0.78–1.13) (A/C) 0.51 rs3779234 76.70 76.90 0.99 (0.80–1.22) (C/T) 0.92 rs3804769 16.30 17.10 0.94 (0.75–1.19) (C/T) 0.63 rs3815045 23.90 22.50 1.08 (0.88–1.33) (A/G) 0.49 rs3818123 46.30 48.20 0.93 (0.78–1.11) (C/T) 0.42 rs4629585 46.40 47.70 0.95 (0.79–1.13) (A/C) 0.56 rs4774113 17.60 21.40 0.79 (0.63–0.99) (G/T) 0.04 rs4938941 27.90 25.70 1.11 (0.91–1.36) (A/G) 0.29 rs506121 60.30 65.10 0.81 (0.68–0.97) (C/T) 0.027 rs553717 69.40 68.20 1.06 (0.88–1.28) (C/T) 0.56 rs723077 54.20 53.50 1.03 (0.86–1.23) (A/C) 0.75 rs760749 78.20 76.10 1.13 (0.92–1.39) (A/C) 0.26 rs8100856 44.90 45.10 0.99 (0.83–1.18) (C/T) 0.96 rs934945 71.80 75.10 0.85 (0.70–1.04) (C/T) 0.106 P values less than 0.05 are indicated in bold
OR Odds ratio; CI confidence interval.
*If the OR was calculated as C/T, then the frequency listed in the table is the frequency of C among all the subjectsTable 3. Alleles discrepancy of the selected 30 variants between cases and controls in the second stage of time of flight mass spectrometry.
-
Polymorphisms Stage Case (n%) Control (n%) OR (95%CI) P value rs506121 (DOCK8) 1 55.90 68.10 0.59 (0.40–0.89) (C/T)* 0.014 2 60.30 65.10 0.81 (0.68–0.97) (C/T) 0.027 1+2 (meta) 0.77 (0.65–0.91) (C/T) 0.002 rs2071676 (CA9) 1 58.90 43.60 1.85 (1.25–2.75) (A/G) 0.002 2 52.60 46.70 1.27 (1.06–1.51) (A/G) 0.009 1+2 (meta) 1.35 (1.15–1.58) (A/G) 0.0003 rs11040923 (DNHD1) 1 63.40 77.00 0.52 (0.34–0.80) (A/G) 0.003 2 67.00 62.40 1.22 (1.02–1.47) (A/G) 0.035 1+2 (meta) 1.07 (0.91–1.27) (A/G) 0.40 P values less than 0.05 in meta-analysis are indicated in bold
DOCK8 Dedicator of cytokinesis 8; CA9 carbonic anhydrase 9; DNHD1 dynein heavy chain domain 1; OR odds ratio; CI confidence interval.
*If the OR was calculated as C/T, then the frequency listed in the table is the frequency of C among all the subjectsTable 4. Allele discrepancy of rs506121, rs2071676, rs11040923 between cases and controls.
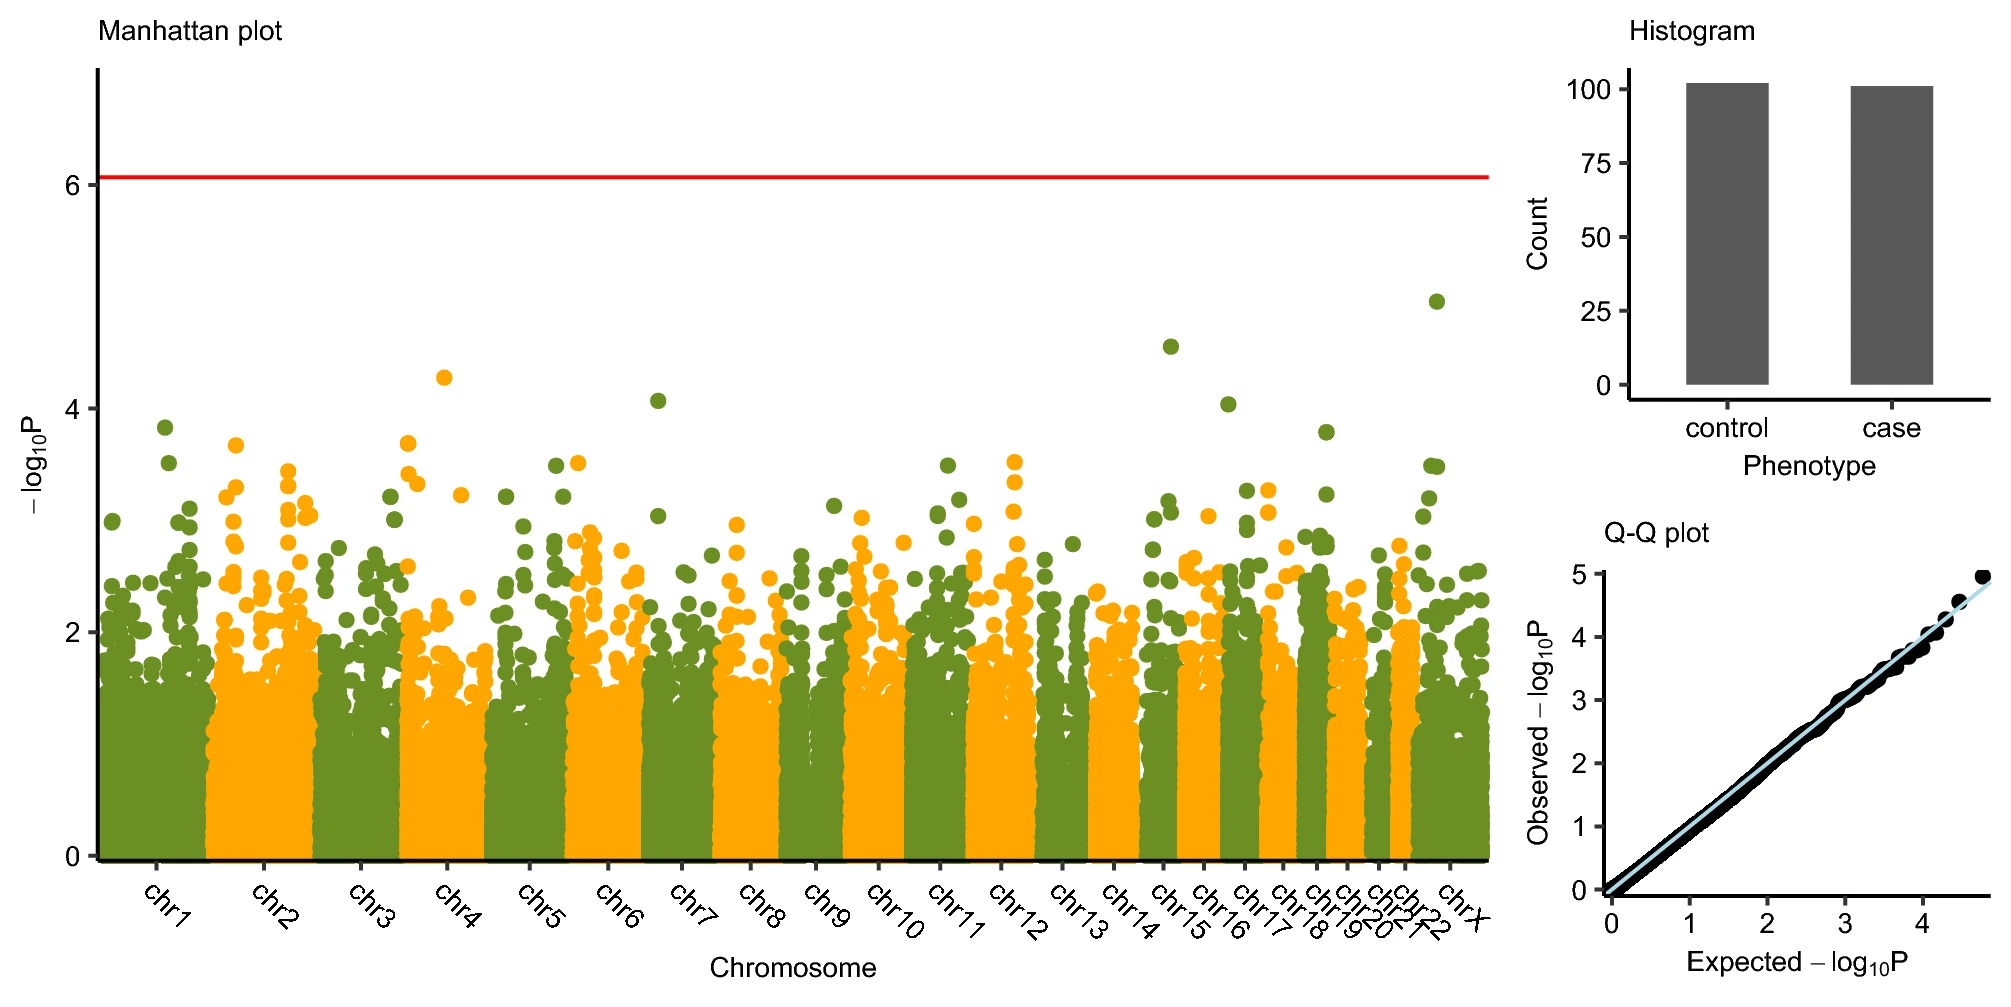
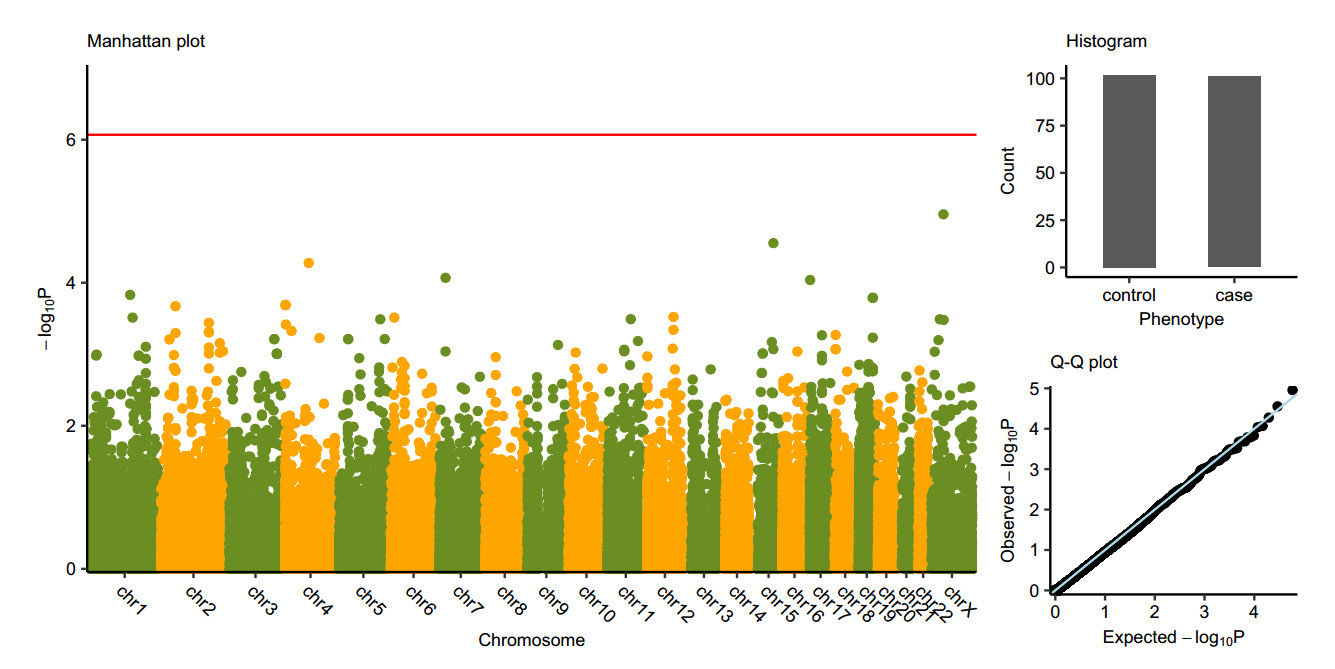
Figure 2 个
Table 5 个