-

-
-
-
-

-

-
-
-
-
-
-
-

Table Table S2. List of Forward and Reverse primers used in quantitative RT-PCR analysis.
-

Table 1. Total number of raw, cleaned and mapped reads of different samples.
-

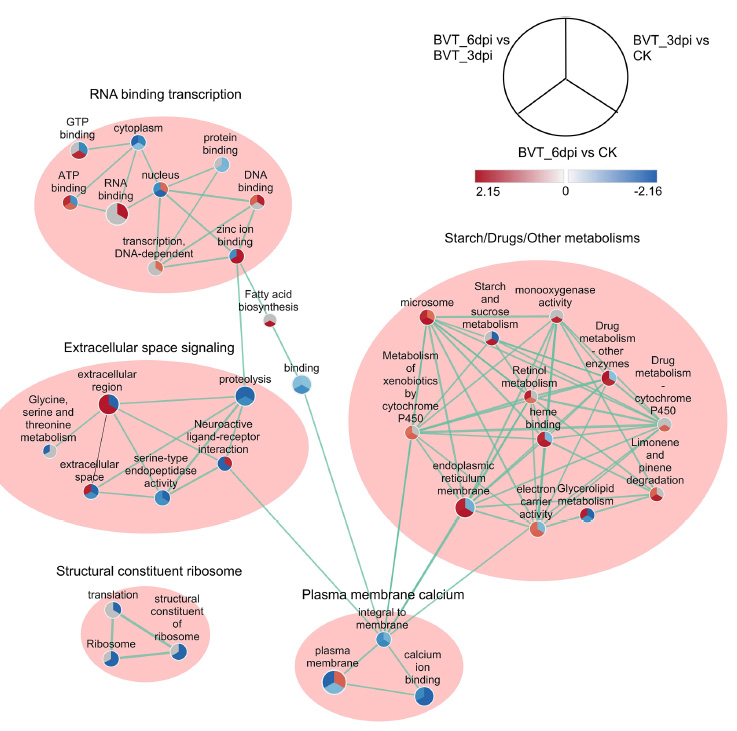
Table Table S1. Expression of genes between samples related to different signal transduction pathways.
-

Table 2. Genes for neuroactive ligand–receptor interaction pathway from KEGG enrichment analysis of significantly differentially expressed genes among pairs.
Figure 12 个
Table 4 个