-
-
-
-
Characteristics HIV negative mothers (n = 72) HIV positive mothers (n = 122) T1 (n = 12) T2 (n = 35) T3 (n = 25) T1 (n = 16) T2 (n = 52) T3 (n = 54) Age at delivery (years) 27.5 (23–42) 29 (19–36) 29 (21–42) 27.5 (24–34) 32 (22–38) 30 (23–38) Duration of infection – – – 3 (1–6) 3 (1–16) 3 (1–10) Duration of HAART treatment (years) – – – 3 (1–6) 3 (1–7) 2 (1–8) Months of gestational 3 (2–3) 5 (4–6) 8 (6–9) 3 (1–3) 5 (4–6) 8 (7–9) Parity (alive–dead) 17 31-1 30-1 20-2 75-5 52-6 Blood pressure (mean, mm/Hg) 109/66 107/69 103/63 103/80 107/73 111/72 BMI index (kg/m2) 27.3 27.6 28.7 28.3 27.2 33.9 HIV, human immunodeficiency virus; BMI, body mass index; T, trimester; HAART, highly active antiretroviral therapy. Table 1. Characteristics of the pregnant mothers (median and range).
-
HIV uninfected control (n = 72) HIV infected HAART treated (n = 122) P value Control vs treated IL-2 Con 3.5 (0–13, 822) 0.0(0–17, 056) 0.32 PW 3.3 (0–1718) 0.0(0–9060) 0.28 PHA 0.2 (0–5064) 0.0(0–105.5) 0.58 TNF-α Con 257.4 (11–5707) 33.6(0–13, 895) 0.11 PW 169.8 (5.9–13, 633) 59.6(2.3–17, 097) 0.30 PHA 149.6(5.8–24, 325) 131.1(0–12, 933) 0.54 IFN-γ Con 21.0(0–4009) 1.1(0–14, 636) 0.04* PW 26.7(15, 985) 5.3(0–17, 673) 0.01* PHA 10.4(0–17, 673) 3.7(0–8586) 0.01* IL-4 Con 3.7(0–18, 379) 0.0(0–11, 070) 0.03* PW 0.0(0–18, 379) 0.0(0–16, 213) 0.24 PHA 0.0(0–16, 213) 0.0(0–16, 213) 0.37 IL-10 Con 14.4(0–19, 577) 0.0(0–12, 960) 0.002* PW 12.8(0–19, 577) 0.0(0–8486) 0.001* PHA 8.2(0–13, 945) 2.0(0–1208) 0.02* IL, interleukin; IFN-γ, interon gamma; TNF-α, tissue necrosis factor alpha; Con A, concanavalin A; PW, pokeweed; PHA, phytohymaglutinin A; vs, versus; HIV, human immunodeficiency virus; HAART, highly active antiretroviral therapy.
*Significant value set at (P < 0.05).Table 2. Cytokine levels (in pg/mL, median and range) after stimulation with PW, Con A and PHA in the supernatant from mothers' peripheral mononuclear cell cultures.
-
Types of stimulation Subjects IL-2 TNF-α IFN-γ IL-4 IL-10 Con A stimulation Pregnant women on HAART (n = 122) 0.0(0–0.55) 18.5 (4–6619) 0.2 (0–4.7) 0.0(0–0) 0.0 (0–0) Control (n = 72) 2.4(0–60.9) 108.7(11–2035) 21.1(0–2920) 4.2(0–10, 756) 86.3(1–17, 840) P value 0.09 0.28 0.11 – – PW stimulation Pregnant women on HAART 0.0(0–282) 39.8 (2–17, 097) 1.0 (0–422) 0.0(0–737) 0.0 (0–0) Control 3.7(0–616) 155.6(6–3203) 59.3(3–10, 150) 0.0(0–742) 72.1(0–1445) P value 0.15 0.59 0.01* 0.33 – PHA stimulation Pregnant women on HAART 0.0(0–15.8) 867.7(0–10, 842) 0.0 (0–162) 0.0(0–0) 0.0 (0–1.9) Control 0.0(0–13.4) 906.3(8.4–4225) 499.4(4–6017) 0.0(0–9876) 33.7(0–13, 945) P value 0.83 0.79 0.03* – 0.04* IL, interleukin; IFN-γ, interon gamma; TNF-α, tissue necrosis factor alpha; Con A, concanavalin A; PW, pokeweed; PHA, phytohymaglutinin A; HAART, highly active antiretroviral therapy; HIV, human immunodeficiency virus.
*Significant value set at (P < 0.05).Table 3. Cytokine levels (in pg/mL, median and range) after stimulation with PW, Con A and PHA in the supernatant from mothers' peripheral mononuclear cell cultures at 1st trimester.
-
Types of stimulation Subjects IL-2 TNF-α IFN-γ IL-4 IL-10 Con A stimulation Pregnant women on HAART (n = 122) 0.9(0–17, 056) 58.2 (0–13, 895) 7.3(0–5270) 0.0(0–6502) 1.1(0–12, 960) Control (n = 72) 4.6(0–13, 822) 250.5(17–2219) 30.0(0–4009) 1.4(0–18, 379) 19.7(0–19, 577) P value 0.93 0.14 0.31 0.23 0.32 PW stimulation Pregnant women on HAART 3.1(0–9060) 104.6(3–11, 331) 5.5(0–17, 673) 0.0(0–4190) 0.5(0–8067) Control 1.1(0–85.4) 103.5(7–13, 633) 70.6(0–15, 985) 2.5(0–18, 379) 32.5(0–3690) P value 0.81 0.57 0.19 0.45 0.03* PHA stimulation Pregnant women on HAART 0.0(0–105.5) 203.3(4–12, 933) 3.8(0–8408) 0.3(0–97) 2.5(0–937) Control 0.9(0–34.8) 203.4(6–6475) 6.8(0–17, 673) 0.0(0–16, 213) 3.7(0–581) P value 0.75 0.79 0.32 0.72 0.45 IL, interleukin; IFN-γ, interon gamma; TNF-α, tissue necrosis factor alpha; Con A, concanavalin A; PW, pokeweed; PHA, phytohymaglutinin A; HAART, highly active antiretroviral therapy; HIV, human immunodeficiency virus.
*Significant value set at (P < 0.05).Table 4. Cytokine levels (in pg/mL, median and range) after stimulation with PW, Con A and PHA in the supernatant from mothers' peripheral mononuclear cell cultures at 2nd trimester.
-
Types of stimulation Subjects IL-2 TNF-α IFN-γ IL-4 IL-10 Con A stimulation Pregnant women on HAART (n = 122) 0.5(0–8740) 33.6(0–13, 495) 3.7(0–4636) 0.3(0–11, 070) 0.0 (0–4794) Control (n = 72) 3.8(0–315) 386.0 (14.7–5707) 22.6(0–2141) 5.3(0–13, 000) 6.6 (0–6352) P value 0.64 0.68 0.28 0.39 0.11 PW stimulation Pregnant women on HAART 0.0(0–8438) 38.6(9.1–2965) 20.9(0–17, 673) 0.0(0–16, 213) 1.1 (0–8486) Control 3.5(0–1718) 202.2 (5.8–2088) 26.6(2.7–7806) 1.9(0–413) 10.4(0–19, 577) P value 0.42 0.95 0.60 0.57 0.02* PHA stimulation Pregnant women on HAART 2.4(0–57.1) 18.7(0–1995) 3.6(0–8586) 0.0(0–16, 213) 2.9 (0–1208) Control 5.7(0–5064) 40.5(5.8–24, 325) 6.9(0–14, 243) 2.7(0–11, 785) 24.2(0–376) P value 0.10 0.43 0.59 0.44 0.27 IL, interleukin; IFN-γ, interon gamma; TNF-α, tissue necrosis factor alpha; Con A, concanavalin A; PW, pokeweed; PHA, phytohymaglutinin A; HAART, highly active antiretroviral therapy; HIV, human immunodeficiency virus.
*Significant value set at (P < 0.05).Table 5. Cytokine levels (in pg/mL, median and range) after stimulation with PW, Con A and PHA in the supernatant from mothers' peripheral mononuclear cell cultures at 3rd trimester.
-
Trimester IL-2 TNF-α IFN-γ IL-4 IL-10 Concanavalin A stimulation 1st 0.0(0–0.55) 18.5(4–6619) 0.2(0–4.7) 0.0(0–0) 0.0(0–0) 2nd 0.9(0–17, 056) 58.2(0–13, 895) 7.3(0–5270) 0.0(0–6502) 1.1(0–12, 960) 3rd 0.5(0–8740) 33.6(0–13, 495) 3.7(0–4636) 0.3(0–11, 070) 0.0(0–47, 944) P value 1st vs 2nd 0.13 0.49 0.11 – – 1st vs 3rd 0.16 0.62 0.36 – – 2nd vs 3rd 0.54 0.76 0.75 0.52 0.58 Pokeweed stimulation 1st 0.0(0–282) 39.8(2–17, 097) 1.0(0–422) 0.0(0–737) 0.0(0–0) 2nd 3.1(0–9060) 104.6 (3–11, 331) 5.5(0–17, 673) 0.0(0–4190) 0.5(0–8067) 3rd 0.0(0–8438) 38.6(9.1–2965) 20.9(0–17, 673) 0.0(0–16, 213) 1.1(0–8486) P value 1st vs 2nd 0.13 0.71 0.25 0.23 – 1st vs 3rd 0.32 0.92 0.07 0.27 – 2nd vs 3rd 0.77 0.98 0.68 0.98 0.85 Phytohemagglutinin stimulation 1st 0.0(0–15.8) 867.7 (0–10, 842) 0.0(0–162) 0.0(0–0) 0.0(0–1.9) 2nd 0.0(0–105.5) 203.3 (4–12, 933) 3.8(0–8408) 0.3(0–97) 2.5(0–937) 3rd 2.4(0–57.1) 18.7(0–1995) 3.6(0–8586) 0.0(0–16, 213) 2.9(0–1208) P value 1st vs 2nd 0.78 0.42 0.27 – 0.12 1st vs 3rd 0.59 0.02* 0.11 – 0.16 2nd vs 3rd 0.65 0.03* 0.66 0.96 0.98 IL, interleukin; IFN-γ, interon gamma; TNF-α, tissue necrosis factor alpha; Con A, concanavalin A; PW, pokeweed; PHA, phytohymaglutinin A; HAART, highly active antiretroviral therapy; HIV, human immunodeficiency virus; vs, versus; 1st, 2nd, 3rd, trimesters.
*Significant value set at (P < 0.05).Table 6. Cytokine levels (in pg/mL, median and range) after stimulation with PW, Con A and PHA in the supernatant from mothers' peripheral mononuclear cell cultures at 1st, 2nd and 3rd trimester.
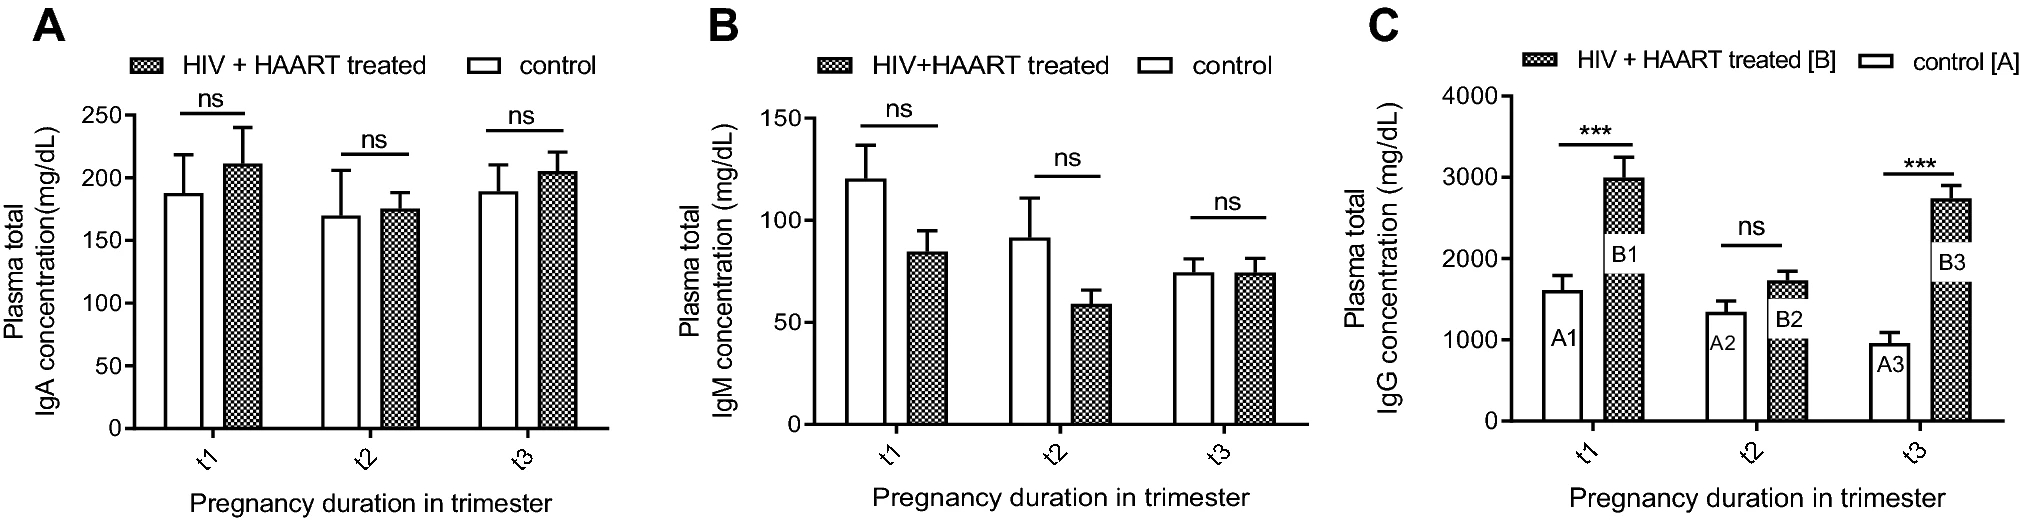
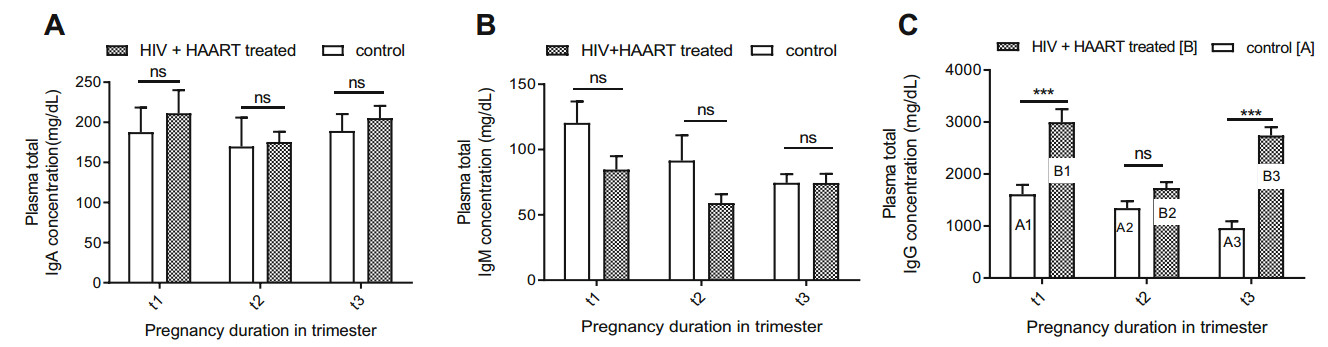
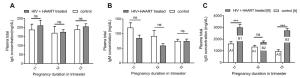
Figure 3 个
Table 6 个