-

-

-
Groups Concentration (μg/mL) Optical density Cell survival rate Inhibitory rate GQP 31.2 0.518±0.040 65.8★★ 52.1 15.6 0.457±0.041 58.1★★▲ 41.3▲ 7.8 0.401±0.028 51.0★★▲▲ 31.3▲▲ 3.9 0.341±0.029 43.4★★▲▲ 20.8▲▲ Ribavirin 15.6 0.503±0.035 63.9★★ 49.5 Normal cell - 0.787±0.041 100★★ - Virus control - 0.225±0.012 28.6 0 GQP or ribavirin was added to Vero cells at the time of EV71 infection (t = 0) except for “Normal cell” and “Virus control” and then incubated at 37 °C in 5% CO2 incubator. When the cytopathic effect (CPE) in the ‘Virus control’ well had reached +++ (when CPE was evident in 50%-75% of the Vero cells) and the cells of the ‘Normal cell’ group were normal, the MTT assay was used to determine.A490 nm . Inhibitory rate (%) = (Aagent - AVirus control ) / (Acell control - AVirus control) ×100%. x±SD, n=3. ★★P < 0.01, compared to “Virus control”; ▲▲P < 0.01, compared to “Ribavirin”; ▲P < 0.05, compared to “Ribavirin”. Table 1. Direct inactivation effect of GQP upon EV71 (n = 3x±SD)
-
Groups Concentration (μg/mL) Optical density Cell survival rate(%) Inhibitory rate(%) GQP 31.2 0.747±0.082 94.2★★▲▲ 91.6▲▲ 15.6 0.681±0.058 85.8★★▲▲ 79.6▲▲ 7.8 0.597±0.043 75.3★★▲▲ 64.4▲▲ 3.9 0.506±0.045 63.8★★▲▲ 47.8▲▲ Ribavirin 15.6 0.391±0.035 49.3★★ 26.9 Normal cell - 0.793±0.041 100★★ - Virus control - 0.243±0.012 30.6 0 GQP or ribavirin was added to Vero cells 2 h prior to viral infection (t = -2) except for “Normal cell” and “Virus control”. Incubation was at 37 ℃ in 5% CO2 incubator. x±SD, n=3. ★★P < 0.01, compared to “Virus control”; ▲▲P < 0.01, compared to “Ribavirin”. Table 2. The preventative effect of GQP upon EV71 adsorption to Vero cells (n=3 x ± SD)
-
Groups Concentration (μg/mL) Optical density Cell survival rate(%) Inhibitory rate(%) GQP 31.2 0.651±0.056 82.1★★▲▲ 74.2▲▲ 15.6 0.598±0.040 75.4★★▲▲ 64.5▲▲ 7.8 0.521±0.046 65.6★★▲ 50.5▲▲ 3.9 0.456±0.029 57.5★★ 38.7▲ Ribavirin 15.6 0.483±0.035 60.9★★ 43.6 Normal cell - 0.793±0.041 100★★ - Virus control - 0.243±0.012 30.6 0 GQP or ribavirin was added to Vero cells 2 h after EV71 infection (t = +2) except for “Normal cell” and “Virus control” and incubated at 37 °C in 5% CO2 incubator. x±SD, n=3. ★★P < 0.01, compared to “Virus control”; ▲▲P < 0.01, compared to “Ribavirin”; ▲P < 0.05, compared to “Ribavirin”. Table 3. The inhibitory effect of GQP on EV71 proliferation in Vero cells (n=3 x ± SD)
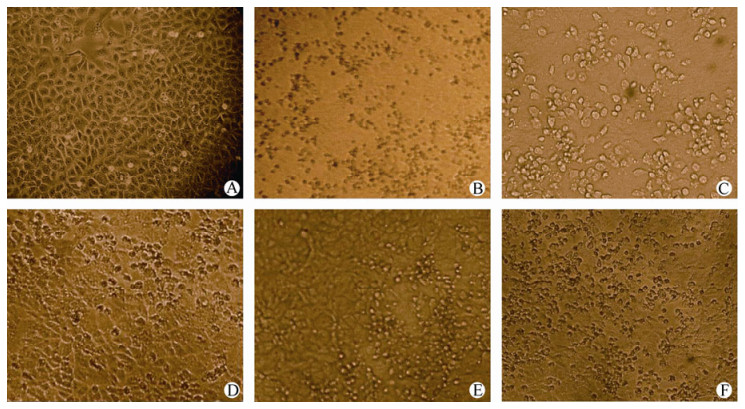
Figure 2 个
Table 3 个