-
-
Variables No. detected Positive numbers Positive rate (%) Chi square test Crowd χ2 = 51.908 General population (GP) 1232 323 26.22 P = 0.00 Workers occupationally contact with swine 273 132 48.35 Total 1505 455 30.23 Gender in GP χ2 = 10.874 Male 582 178 30.58 P = 0.01 Female 650 145 22.31 Total 1232 323 26.22 Age grouping in GP (years) χ2 = 160.925 0–5 165 3 1.82 P = 0.00 6–10 89 5 5.62 11–15 61 4 6.56 16–20 96 9 9.38 21–30 104 24 23.08 31–40 131 43 32.82 41–50 133 49 36.84 51–60 113 48 42.48 61–70 99 44 44.44 71–80 181 69 38.12 81–90 60 25 41.67 Total 1232 323 26.22 Occupational grouping in GPs χ2 = 155.871 Preschool children 181 5 2.76 P = 0.00 Students 219 15 6.85 Peasants 129 60 46.51 Blue-collar workers 112 42 37.5 Managerial staffs 102 39 38.24 Medical staffs 84 18 21.43 Clerks in public place 121 45 37.19 Others 284 99 34.86 Total 1232 323 26.22 Table 1. The positive rates of anti-HEV IgG among recruited cases.
-
Factors Variables β Wald c2 P value OR (95% CI) Chi square test Gender 1 = male, 0 = female 0.15 0.474 0.491 1.162 (0.759–1.779) Age group (years) 24.699 0 2.067 χ2 = 14.649 1≦30 years -1.371 12.969 0 0.254 (0.120–0.535) P = 0.002 2 = 31–40 years -0.824 6.551 0.01 0.439 (0.234–0.825) 3 = 41–50 years -1.044 19.379 0 0.352 (0.221–0.560) Years of Working 23.243 0 6 χ2 = 11.903 1 = 0–5 years, -3.007 13.445 0 0.049 (0.010–0.247) P = 0.018 2 = 6–10 years, -2.772 11.946 0.001 0.063 (0.013–0.301) 3 = 11–15 years, -2.986 13.313 0 0.050 (0.010–0.251) 4 = 16–20 years, -1.576 2.881 0.09 0.207 (0.033–1.276) Educational background 3.5 0.321 0.923 χ2 = 1.749 1 = Primary school -0.811 1.987 0.159 0.444 (0.144–1.373) P = 0.417 2 = Junior school -0.483 0.769 0.381 0.617 (0.210–1.815) 3 = Senior school -0.826 2.067 0.151 0.438 (0.142–1.350) Job pattern 1.95 0.163 1.2 χ2 = 5.637 1 = pig farmers 1.713 7.134 0.068 5.545 (1.011–30.424) P = 0.060 2 = Slaughters 2.396 3.89 0.049 10.984 (1.650–73.130) 3 = Pork retailers 2.303 6.139 0.013 10.009 (1.533–65.349) Working hours per day 2.214 0.331 1.506 χ2 = 8.077 1≦6 h -0.008 0 0.985 1.008 (0.452–2.247) P = 0.018 2 = 7–9 h -0.398 1.012 0.315 0.670 (0.307–1.462) Table 2. Analysis for influent factors of the positive rates of anti-HEV IgG among workers occupationally contacted with swine using logistic regression model.
-
Variables No. detected Positive numbers Positive rate (%) Chi square test Gender χ2 = 0.634 Male 767 14 1.83 P = 0.226 Female 738 16 2.17 Age grouping (years) χ2 = 0.268 0–10 254 0 0 P = 8.793 11–20 161 1 0.62 21–30 132 0 0 31–40 174 7 4.02 41–50 246 7 2.85 51–60 189 4 2.12 61–70 107 4 3.74 71–80 182 5 2.75 81–90 60 2 3.33 Occupation grouping χ2 = 76.158 Preschool children 181 0 0 P = 0.000 Students 219 1 0.46 Peasants 129 10 7.75 Blue-collar workers 112 0 0 Managerial staffs 102 0 0 Medical staffs 84 0 0 Clerks in public place 121 11 9.09 Others 284 0 0 Pig farmers 137 3 2.19 Pork retailers 104 5 4.81 Slaughterers 24 0 0 Veterinarians 8 0 0 Table 3. The positive rates of anti-HEV IgM using Chi square test among general population and workers occupationally contacted with swine.
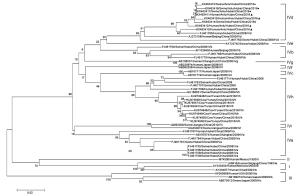
Figure 1 个
Table 3 个
