-
-
-
-
-
-
Characteristics Age-years, mean ± SD 59.83 ± 12.94 Gender—n/N (%) Male 12/22 (54.55) Female 10/22 (45.45) Underlying diseases—n/N (%) Hypertension 10/22 (45.45) Diabetes 9/22 (40.91) Chronic respiratory diseases 3/22 (13.64) Chronic renal disease 3/22 (13.64) Coronary heart disease 2/22 (9.09) Cancer 2/22 (9.09) Chronic hepatitis 1/22 (4.55) Disease Severity of COVID-19—n/N (%) Non-severe 12 (54.55) Severe 10 (45.45) Initial symptoms—n/N (%) Cough 20/22 (90.90) Fever 18/22 (81.82) Fatigue 12/22 (54.55) Dyspnea 8/22 (36.36) Chest tightness 7/22 (31.82) Myalgia 4/22 (18.18) Diarrhoea 2/22 (9.09) Nausea or vomit 1/22 (4.55) Clinical outcomes†—n/N (%) Symptoms alleviated 22 (100) Presented symptoms 1 (4.55) Chest computed tomography improved or almost normal 22/22 (100.00) Freedom of oxygen treatment 22/22 (100.00) Highest body temperature within 72 h prior to sampling (℃) 36.64 ± 0.38 Data presented as n(n/N %) or otherwise indicated, where N is the total patients.
†as of studied time.
SD, standard deviation.Table 1. Demographics and clinical characteristics of studied patients.
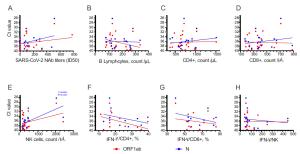
Figure 5 个
Table 1 个