-

-

-

-
qRT-PCR I-RPA Total Positive Negative Positive 39 3 42 Negative 0 53 53 Total 39 56 95 The results were analyzed by Kappa consistency test. Kappa = 0.936. Table 1. Detected results of clinical samples by I-RPA and qRT-PCR assay.
-
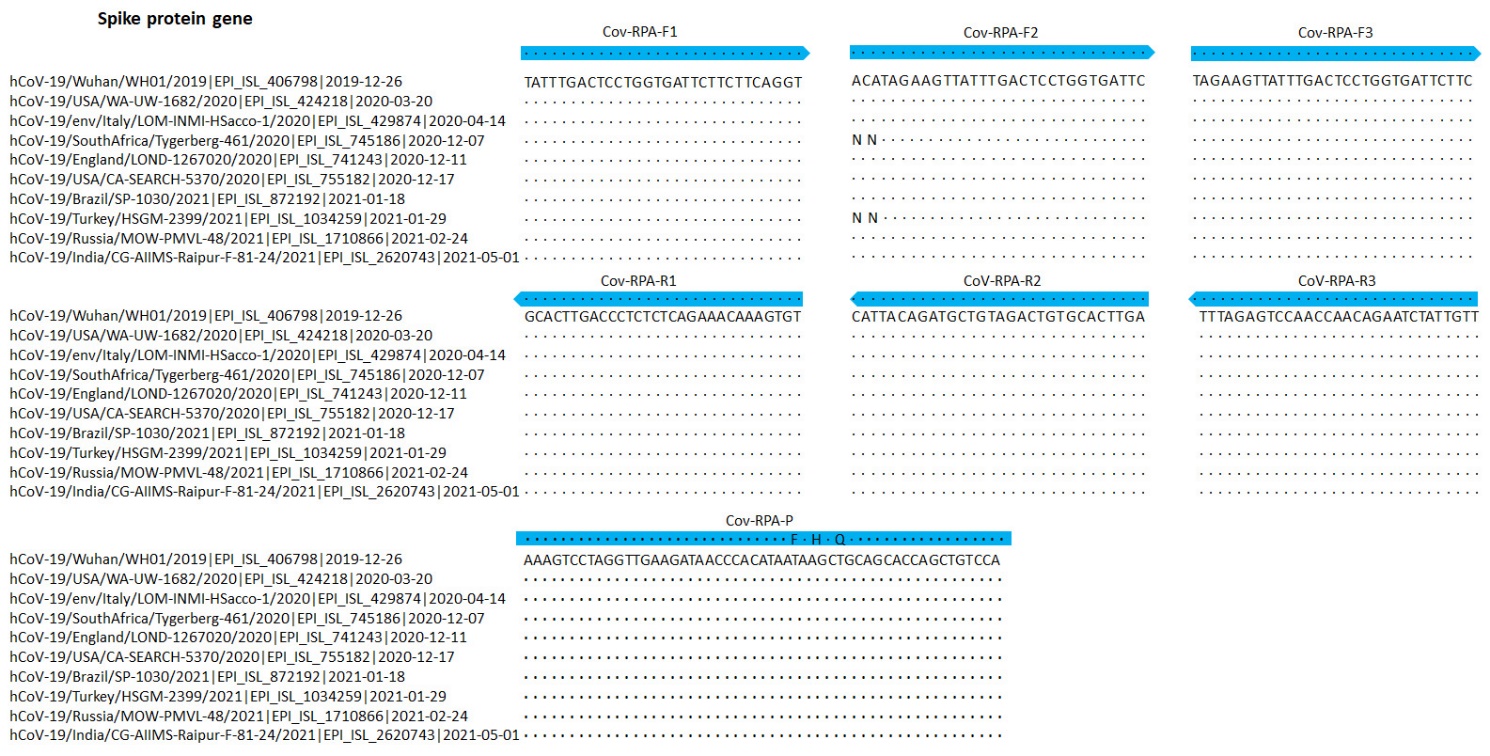
Primer name Sequence (5'to 3')a Position (size, bp)b Cov-RPA-F2 ACATAGAAGTTATTTGACTCCTGGTGATTC 22, 269–22, 298 (30) Cov-RPA-F3 TAGAAGTTATTTGACTCCTGGTGATTCTTC 22, 272–22, 301 (30) Cov-RPA-F1 TATTTGACTCCTGGTGATTCTTCTTCAGGT 22, 279–22, 308 (30) Cov-RPA-P AAAGTCCTAGGTTGAAGATAACCCACATAAFAAHCQGCAGCACCAGCTGTCCA-[3'-block] 22, 309–22, 361 (53) Cov-RPA-R1 ACACTTTGTTTCTGAGAGAGGGTCAAGTGC 22, 411–22, 440 (30) CoV-RPA-R2 TCAAGTGCACAGTCTACAGCATCTGTAATG 22, 389–22, 418 (30) CoV-RPA-R3 AACAATAGATTCTGTTGGTTGGACTCTAAA 22, 489–22, 518 (30) a F: FAM-dT, thymidine nucleotide carrying fluorescein; H: THF, tetrahydrofuran spacer; Q: BHQ1-dT, thymidine nucleotide carrying Black-Hole Quencher 1; 3'-block: 3'-phosphate introduced to block elongation.
b Numbers in position column are primer positions according to SARS-CoV-2, hCoV-19/Wuhan/WH01/2019|EPI_ISL_406798|2019-12-26Table Table S1. Sequences of the primers and probe used for the RPA assay
-
Sample Results Sample Results I-RPA Real-time Ct value (Mean ±2SD) I-RPA Real-time Ct value (Mean ±2SD) P1 P 27.31±0.92 P22 P 19.8±0.18 P2 P 26.98±0.33 P23 P 25.31±0.06 P3 P 29.72±0.72 P24 P 22.9±0.08 P4 P 29.81±0.07 P25 P 26.59±0.72 P5 P 29.2±0.43 P26 P 22.88±0.32 P6 P 29.07±0.78 P27 P 31.72±0.16 P7 P 28.53±0.22 P28 P 30.65±0.21 P8 P 27.66±0.56 P29 P 33.79±0.37 P9 P 31.71±0.20 P30 P 29.46±0.52 P10 P 32.9±0.14 P31 P 25.27±0.68 P11 P 29.92±0.77 P32 P 35.83±0.77 P12 P 29.2±0.65 P33 P 25.75±0.89 P13 P 29.07±0.32 P34 P 36.58±0.48 P14 P 31.59±0.35 P35 P 20.71±0.86 P15 P 33.48±0.12 P36 P 35.31±0.22 P16 P 33.14±0.42 P37 P 36±0.72 P17 N 36.84±0.68 P38 N 38.69±0.33 P18 N 37.11±0.32 S1 P 33.21±0.71 P19 P 25±1.14 S2 P 29.09±1.32 P20 P 27.88±0.98 S3 P 29.91±0.62 P21 P 17.31±1.08 S4 P 32.83±0.88 P: positive; N: negative; P1-P38: Pharyngeal swab samples; S1-S4:Sputum samples.
SD: standard deviationTable Table S2. Analysis of clinical samples by I-RPA and rRT-PCR
Figure 3 个
Table 3 个