-
-
-
-
Number of cases % Sources of birds during outbreaks Commercial/backyard farms 157 32.6 LBMs/"unspecified" poultry suppliers 325 67.4 RT-PCR Positive 346 71.8 Negative 136 28.2 Source of positive cases Commercial/backyard farms 139 40.2 LBMs/"unspecified" poultry suppliers 207 59.8 Geographic origin of positive cases Northern region 220 63.6 Southern region 126 36.4 Within-region distribution of positive cases Northern region 220 (out of 348 cases) 63.2 Southern region 126 (out of 134 cases) 94 Statistical analysis was performed using SPSS version 21 (SPSS Inc., Chicago, IL). Range and proportions were calculated for relevant variables. The relationships between HPAI (H5N1)-positive cases by reverse transcriptase-polymerase chain reaction (RT-PCR) and corresponding variables were determined by Fisher’s exact test at P < 0.05. Table 1. Summary of HPAIH5N1 outbreak markers (December 2014 to November 2016).
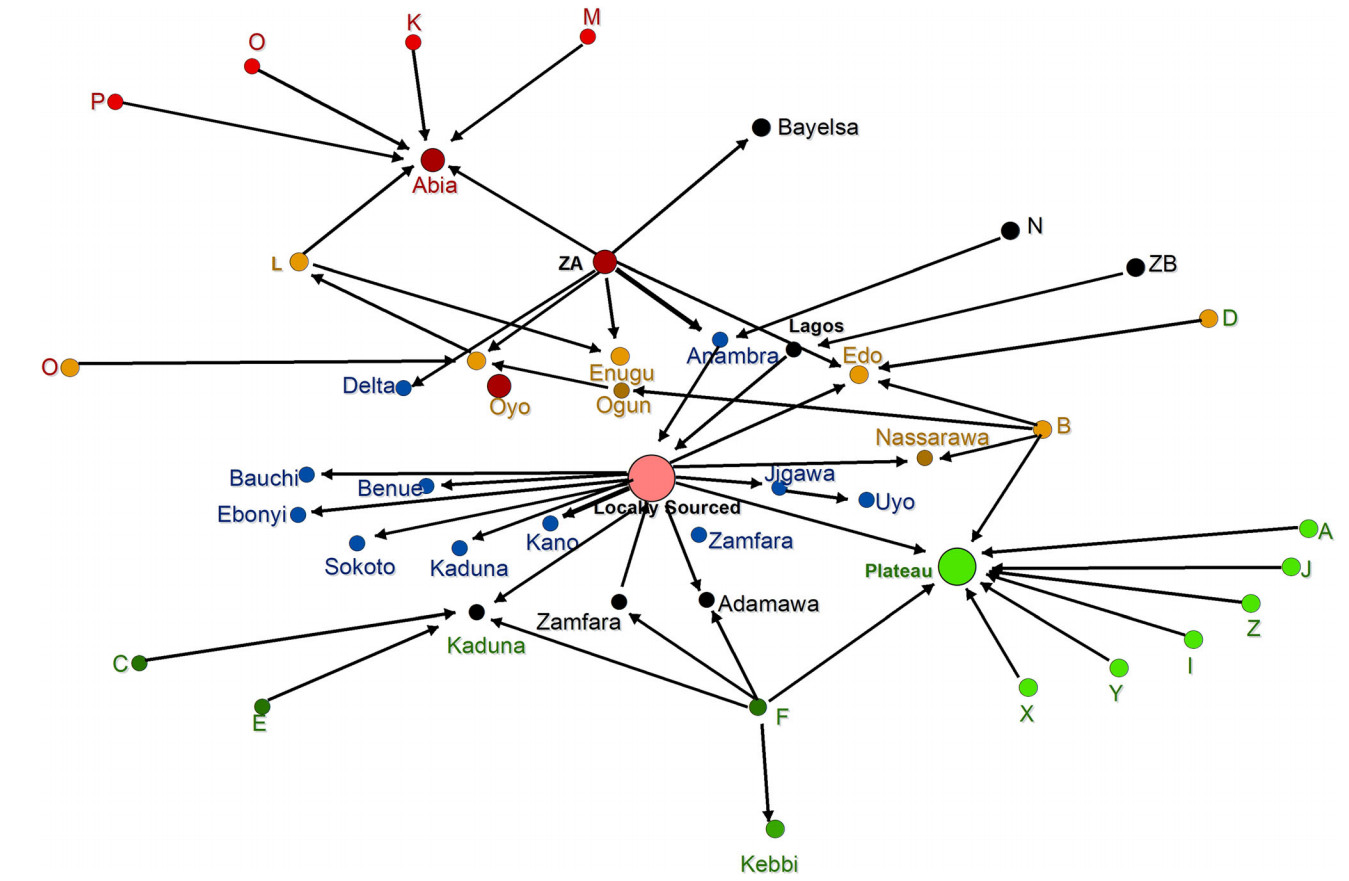
Figure 3 个
Table 1 个