-
-
-
Patient No. Sex Age, y Onset days Anamnesis Patients treated with Leflunomide 1 M 65 10 None 2 F 61 10 Hypertension 3 M 47 9 None 4 F 51 8 Hypertension, Hyperlipidemia 5 F 51 10 Hypertension, Atherosclerosis Patients treated with blank 1 F 54 9 Hypertension, Atherosclerosis, Hysteromyoma 2 F 50 10 Atherosclerosis 3 M 56 10 Hypertension 4 F 63 8 COPD 5 F 51 9 Hypertension P value 1 0.91 Table 1. Clinical characteristics of SARS-CoV-2-infected patients.
-
Parameters Leflunomide, n = 5 Control, n = 5 Before treatment After treatment P value Before treatment After treatment P value WBC, × 109/L (3.5–9.5) 4.67 (3.91–7.61) 5.97 (4.34–9.69) 0.715 5.28 (3.95–6.97) 5.58 (3.27–7.47) 0.893 Differences before and after treatment 1.73 (0.63–5.59) – 0.95 (0.68–2.27) 0.624 N, × 109/L (1.8–6.3) 2.80 (2.00–6.60) 4.56 (2.54–7.52) 0.715 2.78 (1.81–4.62) 2.89 (1.48–4.3) 0.893 Differences before and after treatment 2.04 (0.31–5.08) – 0.49 (0.33–1.90) 0.327 L, × 109/L (1.1–3.2) 0.9 (0.58–1.58) 1.18 (0.95–1.41) 0.465 1.83 (1.13–2.02) 2.21 (1.30–2.36) 0.225 Differences before and after treatment 0.46 (0.30–0.55) – 0.36 (0.17–0.68) 0.624 Platelet count, × 109/L (125–350) 217 (200.5–230.5) 195.5 (152.5–270) 0.465 258 (181–315) 231 (221.5–246.5) 0.893 Differences before and after treatment 40.5 (4.75–86) – 43 (31.5–79.5) 0.624 Alkaline phosphatase, U/L (45–125) 74 (45.5–156) 76 (48–143.75) 0.273 76 (67–83) 73 (65–85.5) 0.893 Differences before and after treatment 15.5 (5.75–54.5) – 4 (2–12) 0.11 Bilirubin, mmol/L (0–23) 15.4 (11.2–18.15) 13.45 (6.7–20.58) 1 8.5 (6.05–10.65) 6.8 (5.95–7.1) 0.225 Differences before and after treatment 4.2 (1.98–10.4) – 1.8 (1.25–4.15) 0.176 Potassium, mmol/L (3.5–5.3) 3.79 (3.45–4.05) 3.75 (3.23–4.07) 0.715 3.9 (3.8–4.16) 4.26 (3.72–4.48) 0.345 Differences before and after treatment 0.19 (0.12–0.35) – 0.57 (0.05–0.7) 0.624 Sodium, mmol/L (137–147) 132 (132–139) 139 (135.75–143.75) 0.068 137 (134.5–141.5) 143 (138.5–147.5) 0.136 Differences before and after treatment 5.5 (3.5–11.25) – 3 (1.5–12.0) 0.387 Urea, mmol/L (2.17–7.14) 3.1 (2.25–4.63) 3.62 (2.1–5.56) 1 4.89 (4.30–5.58) 4.55 (3.66–4.67) 0.138 Differences before and after treatment 0.62 (0.16–2.28) – 0.64 (0.34–1.48) 0.624 Creatinine, μmol/L (57–97) 51 (43.5–78.0) 63 (44.25–78) 0.285 55 (47.5–61.5) 52 (47.5–58) 0.581 Differences before and after treatment 3 (0.5–6.25) – 4 (1.5–8.5) 0.707 Albumin, g/L (40–55) 40.1 (37.0–43.6) 31.7 (26.35–37.43) 0.068 41.8 (38.45–44.45) 40.8 (39.6–41.65) 0.686 Differences before and after treatment 6.35 (4.48–16.18) – 3.8 (1.05–4.5) 0.05 Haemoglobin, g/L (130–175) 140 (117–157.5) 115 (101–134) 0.08 135 (125–178.5) 112 (108.5–127) 0.043 Differences before and after treatment 26 (4–38) – 27 (8–58) 0.465 Creatine kinase, U/L (50–310) 50 (34.5–79.5) 24 (19– N.T.) 0.109 70 (41.5–96) 48 (30.5–63) 0.043 Differences before and after treatment 31 (25– N.T.) – 11 (3.5–46) 0.368 CRP, mg/L (0–10) 37.4 (7.8–120.6) 5 (5–5) 0.109 5 (5–14.75) 5 (5–5.7) 0.18 Differences before and after treatment 32 (5.6–N.T.) – 0 (0–9.05) 0.047 ALT, U/L (9–50) 26 (19.5–80.5) 123.5 (61.25–251.75) 0.068 18 (17–34.5) 23 (15–42) 0.684 Differences before and after treatment 58.5 (36.75–186) – 8 (6.5–29.5) 0.049 AST, U/L (15–40) 23 (17.5–47.5) 83(37.25–96.5) 0.068 18 (17–23.5) 16 (14.5–35) 0.893 Differences before and after treatment 48.5 (13.5–55) – 6 (4–20) 0.176 Tmax (℃) 38 (38–38.85) 38 (37.95–38.65) 0.738 Antipyretic time (d) 2 (1–3) 3 (2.5–3.5) 0.131 The data are presented as the medians and interquartile ranges. P values comparing cases are from Mann-Whitney U-test.
WBC white blood cell, N neutrophil, L lymphocyte, CRP C-reactive protein, ALT alanine aminotransferase, AST aspartate aminotransferase, Tmax maximum body temperature, N.T. not tested.Table 2. Clinical parameters between the Leflunomide group and the control group.
-
Patient No. Patients treated with Leflunomide Patients treated with blank P value 1 3 4 1 4 5 Viral shedding time after treatment (d) 4 8 5 11 9 11 0.046 The data are presented as medians. P values comparing cases are from Mann-Whitney U-test. Table 3. Viral shedding time after drug treatment of indicated patients.
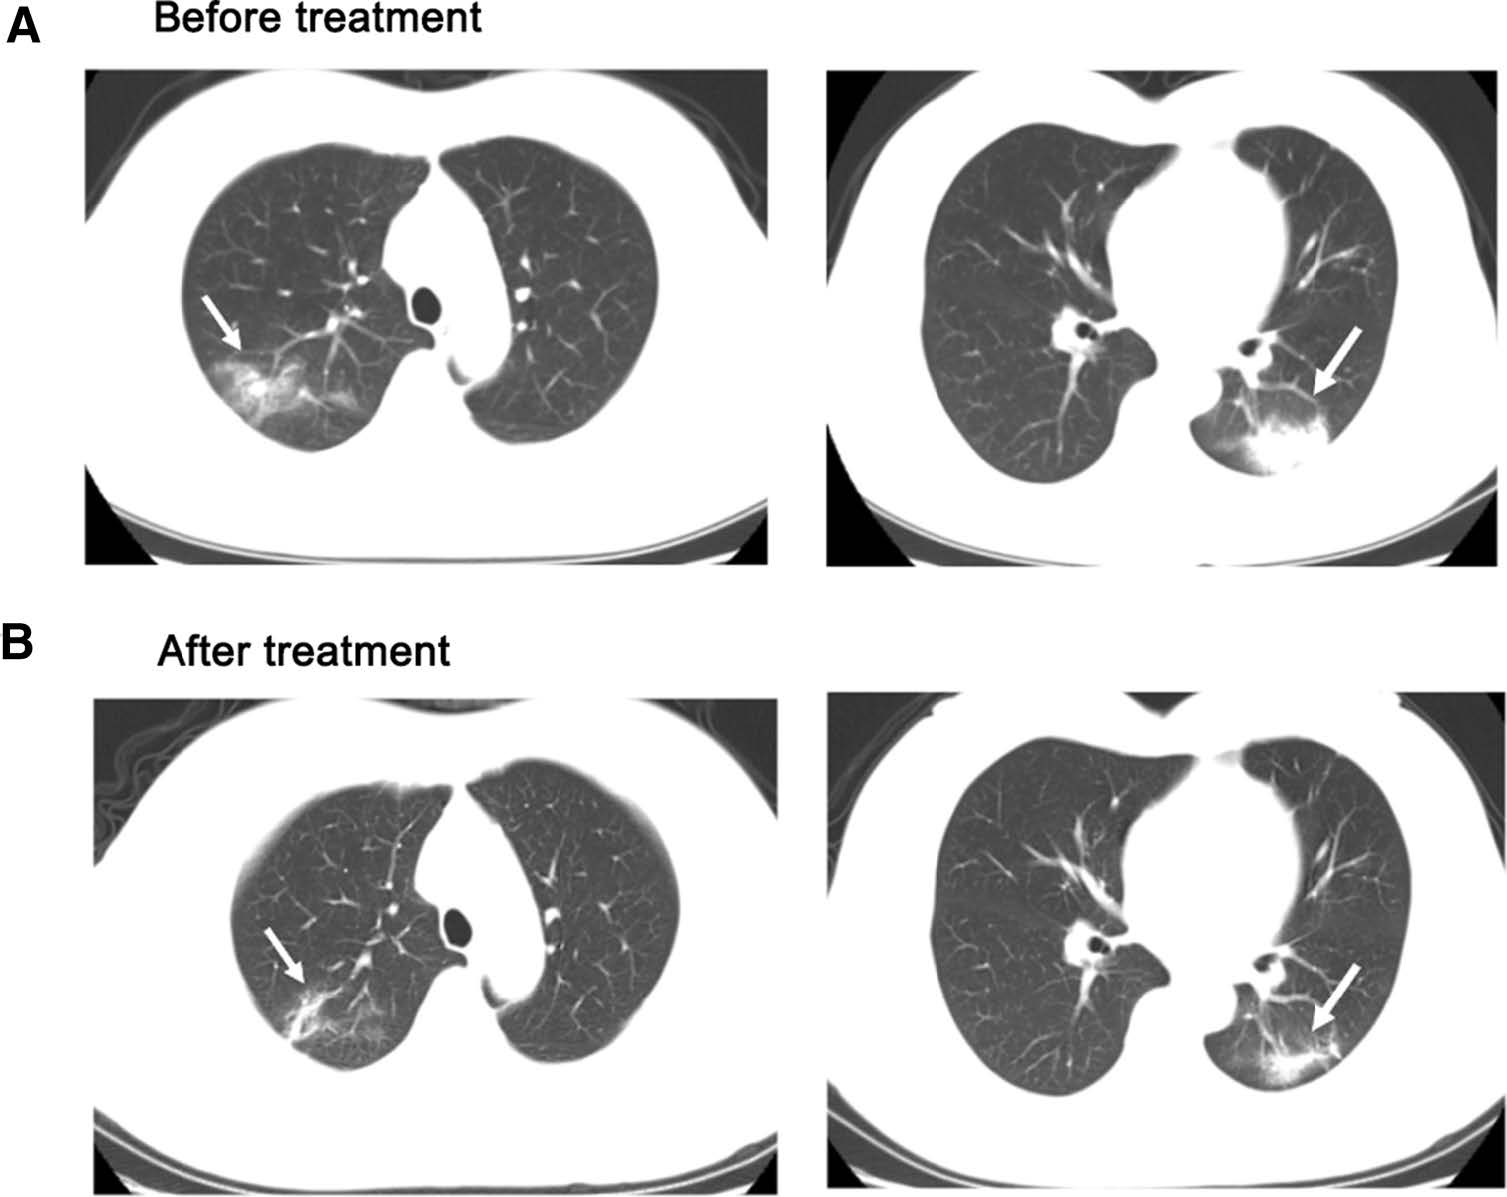
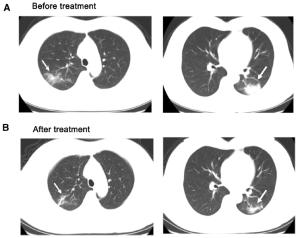
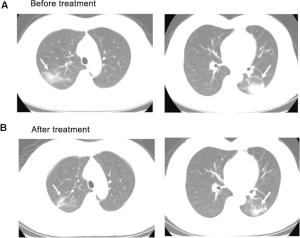
Figure 2 个
Table 3 个