-
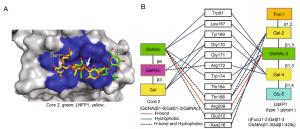
-
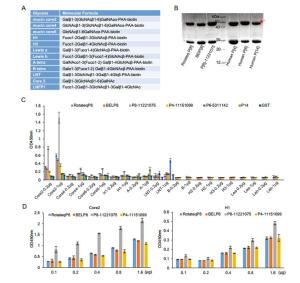
-
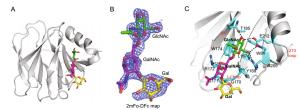
-
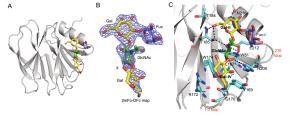
-
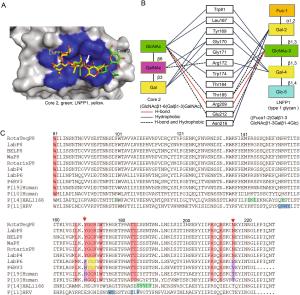
-
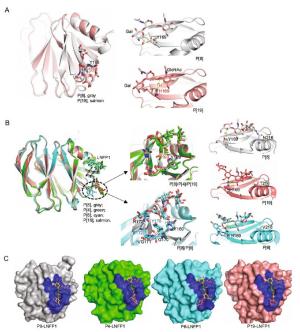
-
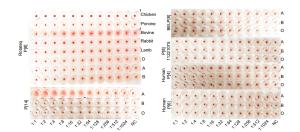
-

-
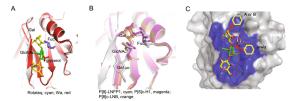
-
Parametera RotaTeq P[8] VP8*-Core 2 RotaTeq P[8] VP8*-LNFP1 Data collection Space group P21 P6322 Cell dimensions a, b, c (Å) 66.289 80.454 114.55 80.454 73.789 116.593 α, β, γ (°) 90, 95.959, 90 90, 90, 120 Wavelength (Å) 0.97774 0.97852 Resolution (Å) 50.00-1.80 50.00-2.30 (1.86-1.8) (2.38-2.30) Rmerge (%)b 8.4 (80.4) 15.9 (86.0) I/σI 21.597 (1.500) 22.524 (4.889) Completeness (%) 98.4 (90.3) 99.57 (96.58) Redundancy 5.4 (5.4) 25.8 (27.0) Refinement Resolution (Å) 43.24-1.80 44.71-2.30 No. reflections 86599 10481 Rwork/Rfree 0.2024/0.2288 0.2035/0.2331 No. atoms Protein 7860 1336 Ligand/ion 80 52 Water 781 80 B-factors Protein 23.5 31.1 Ligand 59.8 74.7 Water 34.4 39.6 R.m.s. deviations Bond lengths (Å) 0.005 0.003 Bond angles (°) 0.69 0.54 Ramachandran plot Favored (%) 97.47 98.14 Allowed (%) 2.53 1.86 Disallowed (%) 0.00 0.00 aValues in parentheses are given for the highest resolution shell.
b Rmerge =$\Sigma \mathrm{hkl}|\mathrm{I}- <\mathrm{I}>| / \Sigma \mathrm{hklI} $ $ <\mathrm{I}>$ Table 1. Crystallographic X-ray diffraction and refinement statistics.
Figure 9 个
Table 1 个