-

-
-
Characteristic Total samples (n) HAdV positive samples (n) Positive rate (%) HAdV isolates (n) χ2/Fisher exact probabilities P value HAdV-1 HAdV-2 HAdV-3 HAdV-4 HAdV-7 Gender Male 883 41 4.64 0 5 3 2 0 0.382 0.537 Female 851 45 5.29 5 2 5 0 1 Age(year) < 0.5 47 4 8.51 1 0 0 0 0 – < 0.001 0.5~ 69 2 2.90 0 0 0 0 0 1~ 85 9 10.59 0 2 0 0 1 2~ 75 9 12.00 1 1 1 0 0 3~ 59 5 8.47 0 0 1 0 0 4~ 69 11 15.94 2 2 2 1 0 5~ 82 3 3.66 0 0 1 1 0 10~ 39 2 5.13 0 0 0 0 0 15~ 104 5 4.81 0 2 0 0 0 20~ 507 12 2.37 1 0 1 0 0 40~ 367 11 3.00 0 0 2 0 0 60~95 231 13 5.63 0 0 0 0 0 Sampling intervals (day) 0~ 230 9 3.91 0 1 2 0 0 7.407 0.192 1~ 579 27 4.66 1 4 1 0 0 2~ 520 25 4.81 3 2 1 2 0 3~ 215 17 7.91 1 0 2 0 0 4~ 86 6 6.98 0 0 0 0 1 5~20 104 2 1.92 0 0 2 0 0 Total 1743 86 4.96 5 7 8 2 1 Table 1. Characteristics of gender, age and sampling intervals distribution of patients for HAdVs positive in Xining City in 2018.
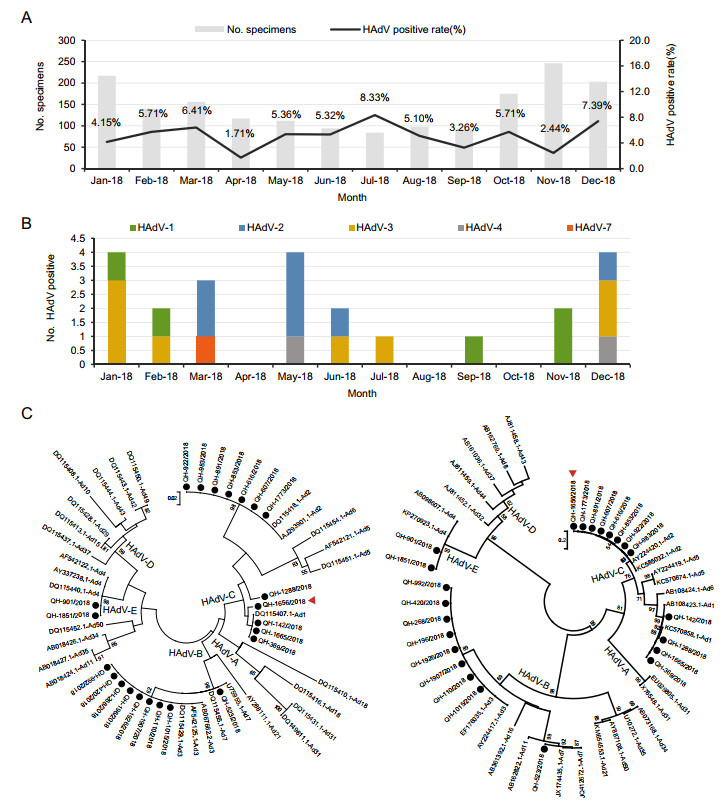
Figure 2 个
Table 1 个