-
-
-
-
-
-
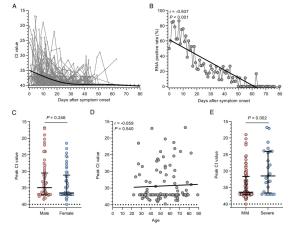
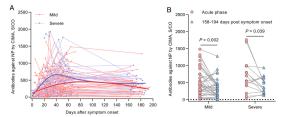
Total (n = 112) Mild (n = 87) Severe (n = 25) P value Age, years 54 (40.25–66) 50 (38–64) 65 (52–75.5) < 0.001* Male 62 (55.36%) 45 (51.72%) 17 (68.00%) 0.176 Onset of symptoms to Hospital admission, days 7 (2.25–13) 9 (3–13) 6 (1–8) 0.064 RNA confirmation, days 7 (3–12) 9 (3–14) 5 (2–7.5) 0.004* Signs and symptoms Fever (temperature ≥ 37.3 ℃) 86 (76.79%) 66 (75.86%) 20 (80.00%) 0.792 Chest tightness 17 (15.18%) 11 (12.64%) 6 (24.00%) 0.205 Night sweats 2 (1.79%) 1 (1.15%) 1 (4.00%) 0.398 Shortness of breath 22 (19.64%) 15 (17.24%) 7 (28.00%) 0.259 Chill 11 (9.82%) 5 (5.75%) 6 (24.00%) 0.015* Fatigue 37 (33.04%) 24 (27.59%) 13 (52.00%) 0.030* Dry cough 61 (54.46%) 50 (57.47%) 11 (44.00%) 0.261 Vomiting 3 (2.68%) 2 (2.30%) 1 (4.00%) 0.535 Anorexia 17 (15.18%) 10 (11.49%) 7 (28.00%) 0.058 Palpitation 8 (7.14%) 3 (3.45%) 5 (20.00%) 0.013* Myalgia 3 (2.68%) 1 (1.15%) 2 (8.00%) 0.125 Dyspnoea 15 (13.39%) 11 (12.64%) 4 (16.00%) 0.740 Expectoration 16 (14.29%) 13 (14.94%) 3 (12.00%) 1.000 Pharyngalgia 9 (8.04%) 9 (10.34%) 0 (0.00%) 0.204 Diarrhoea 8 (7.14%) 7 (8.05%) 1 (4.00%) 0.681 Nausea 7 (6.25%) 6 (6.90%) 1 (4.00%) 1.000 Dizziness 5 (4.46%) 2 (2.30%) 3 (12.00%) 0.073 Headache 3 (2.68%) 1 (1.15%) 2 (8.00%) 0.125 Serologic test on admission (normal range) C-reactive protein, mg/L (< 8.2) 9.83 (2.03–47.71) 6.27 (1.45–22.62) 51.57 (23.99–113.50) < 0.001* D-Dimer, mg/L (< 0.05) 0.87 (0.36–1.57) 0.7 (0.31–1.46) 1.09 (0.82–2.38) 0.033* Lactate dehydrogenase, U/L (318–618) 232 (199–288) 226.5 (190–258) 306 (205–371) 0.003* White blood cell count, × 109/L (4–10) 5.65 (4.67–7.42) 5.48 (4.47–6.81) 7.26 (5.01–9.66) 0.016* Lymphocyte count, × 109/L (0.8–4) 1.27 (0.9–1.61) 1.35 (1.09–1.71) 0.93 (0.73–1.42) 0.003* Neutrophil count, × 109/L (2–7) 3.8 (2.85–5.23) 3.33 (2.75–4.83) 5.72 (3.76–7.87) < 0.001* Antibodies against NP, S/CO 443.09 (181.77–793.02) 400.12 (172.95–732.51) 548.26 (392.21–1031.98) 0.044* Peak viral load (Ct value) 35.63 (30.87–37) 36.39 (31.62–37) 31.48 (24.03–36.64) 0.002* SARS-CoV-2 RNA persistence, days 15 (9–27) 17.5 (10–27) 12 (7.5–32.5) 0.455 Data are presented as median (interquartile range) and n (%); *P < 0.05 (Student's t test, χ2 test, or Mann–Whitney U test); Ct, cycle threshold; NP, nucleocapsid protein; S/CO, signal-to-cutoff. Table 1. Clinical characteristics of COVID-19 patients.
-
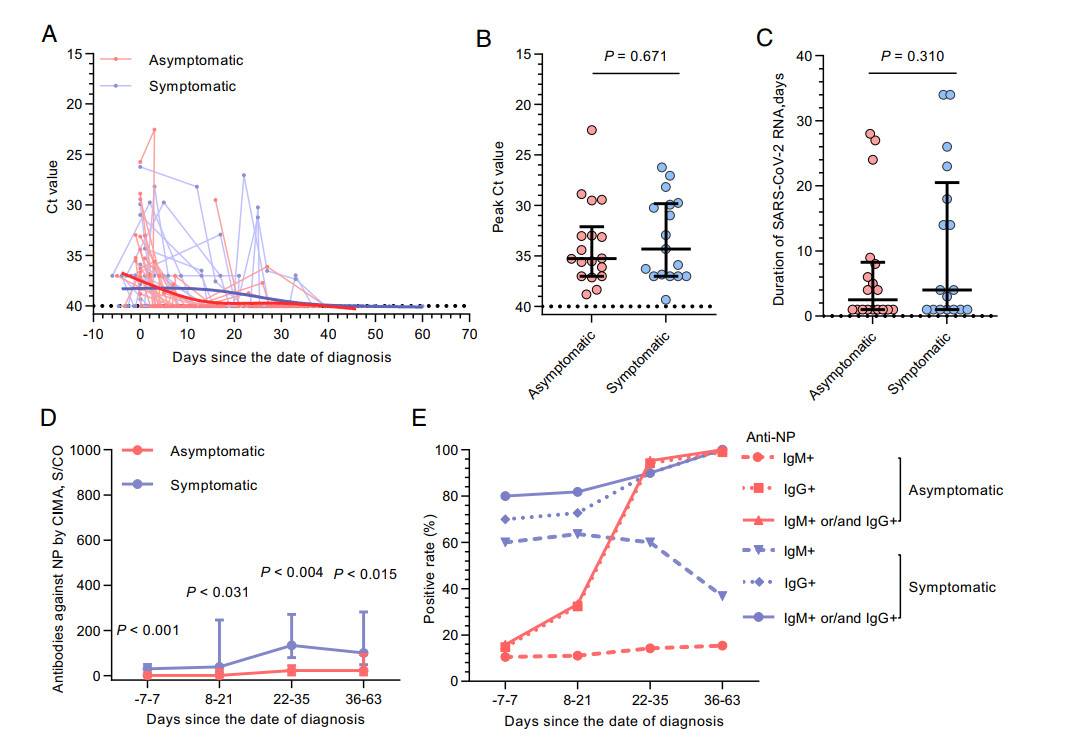
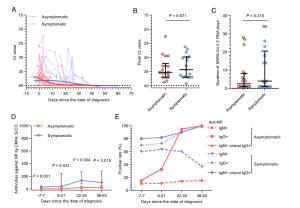
Asymptomatic (n = 18) Symptomatic (n = 17) P value Age, years 38 (23–55.75) 52 (37–63) 0.06 Male 7 (38.89%) 11 (64.71%) 0.181 IgM and IgG against NP peak titre, S/CO 60.79 (9.99–194.54) 302.44 (169.29–567.85) < 0.001* Peak viral load (Ct value) 35.26 (32.1–37) 34.3 (29.82–37) 0.725 RNA persistence, days 2.5 (1–8.25) 4 (1–20.5) 0.508 Data are presented as median (interquartile range) and n (%); *P < 0.05 (χ2 test or Mann–Whitney U test); Ct, cycle threshold; NP, nucleocapsid protein; S/CO, signal-to-cutoff. Table 2. Characteristics of asymptomatic individuals and the related symptomatic cases.
Figure 5 个
Table 2 个